Lithium
45.57
0.6%
Gold
2,680.00
0.3%
Copper
4.11
0.12%
Oil
70.41
0.33%
Bitcoin
98,160.82
(0.3%)
FTSE 100
8,149.27
0.79%
Nikkei 225
38,317.72
0.45%
Dow Jones
43,870.35
0.76%
Iron Ore
102.40
0.38%
USD/AUD
0.65
0.03%
Hang Seng
19,653.66
0.2%
Lithium
45.57
0.6%
Gold
2,680.00
0.3%
Copper
4.11
0.12%
Oil
70.41
0.33%
Bitcoin
98,160.82
(0.3%)
FTSE 100
8,149.27
0.79%
Nikkei 225
38,317.72
0.45%
Dow Jones
43,870.35
0.76%
Iron Ore
102.40
0.38%
USD/AUD
0.65
0.03%
Hang Seng
19,653.66
0.2%
Lithium
45.57
0.6%
Gold
2,680.00
0.3%
Copper
4.11
0.12%
Oil
70.41
0.33%
Bitcoin
98,160.82
(0.3%)
FTSE 100
8,149.27
0.79%
Nikkei 225
38,317.72
0.45%
Dow Jones
43,870.35
0.76%
Iron Ore
102.40
0.38%
USD/AUD
0.65
0.03%
Hang Seng
19,653.66
0.2%
Lithium
45.57
0.6%
Gold
2,680.00
0.3%
Copper
4.11
0.12%
Oil
70.41
0.33%
Bitcoin
98,160.82
(0.3%)
FTSE 100
8,149.27
0.79%
Nikkei 225
38,317.72
0.45%
Dow Jones
43,870.35
0.76%
Iron Ore
102.40
0.38%
USD/AUD
0.65
0.03%
Hang Seng
19,653.66
0.2%
Lithium
45.57
0.6%
Gold
2,680.00
0.3%
Copper
4.11
0.12%
Oil
70.41
0.33%
Bitcoin
98,160.82
(0.3%)
FTSE 100
8,149.27
0.79%
Nikkei 225
38,317.72
0.45%
Dow Jones
43,870.35
0.76%
Iron Ore
102.40
0.38%
USD/AUD
0.65
0.03%
Hang Seng
19,653.66
0.2%
Lithium
45.57
0.6%
Gold
2,680.00
0.3%
Copper
4.11
0.12%
Oil
70.41
0.33%
Bitcoin
98,160.82
(0.3%)
FTSE 100
8,149.27
0.79%
Nikkei 225
38,317.72
0.45%
Dow Jones
43,870.35
0.76%
Iron Ore
102.40
0.38%
USD/AUD
0.65
0.03%
Hang Seng
19,653.66
0.2%
Lithium
45.57
0.6%
Gold
2,680.00
0.3%
Copper
4.11
0.12%
Oil
70.41
0.33%
Bitcoin
98,160.82
(0.3%)
FTSE 100
8,149.27
0.79%
Nikkei 225
38,317.72
0.45%
Dow Jones
43,870.35
0.76%
Iron Ore
102.40
0.38%
USD/AUD
0.65
0.03%
Hang Seng
19,653.66
0.2%
Lithium
45.57
0.6%
Gold
2,680.00
0.3%
Copper
4.11
0.12%
Oil
70.41
0.33%
Bitcoin
98,160.82
(0.3%)
FTSE 100
8,149.27
0.79%
Nikkei 225
38,317.72
0.45%
Dow Jones
43,870.35
0.76%
Iron Ore
102.40
0.38%
USD/AUD
0.65
0.03%
Hang Seng
19,653.66
0.2%
Lithium
45.57
0.6%
Gold
2,680.00
0.3%
Copper
4.11
0.12%
Oil
70.41
0.33%
Bitcoin
98,160.82
(0.3%)
FTSE 100
8,149.27
0.79%
Nikkei 225
38,317.72
0.45%
Dow Jones
43,870.35
0.76%
Iron Ore
102.40
0.38%
USD/AUD
0.65
0.03%
Hang Seng
19,653.66
0.2%
Lithium
45.57
0.6%
Gold
2,680.00
0.3%
Copper
4.11
0.12%
Oil
70.41
0.33%
Bitcoin
98,160.82
(0.3%)
FTSE 100
8,149.27
0.79%
Nikkei 225
38,317.72
0.45%
Dow Jones
43,870.35
0.76%
Iron Ore
102.40
0.38%
USD/AUD
0.65
0.03%
Hang Seng
19,653.66
0.2%
Lithium
45.57
0.6%
Gold
2,680.00
0.3%
Copper
4.11
0.12%
Oil
70.41
0.33%
Bitcoin
98,160.82
(0.3%)
FTSE 100
8,149.27
0.79%
Nikkei 225
38,317.72
0.45%
Dow Jones
43,870.35
0.76%
Iron Ore
102.40
0.38%
USD/AUD
0.65
0.03%
Hang Seng
19,653.66
0.2%
Lithium
45.57
0.6%
Gold
2,680.00
0.3%
Copper
4.11
0.12%
Oil
70.41
0.33%
Bitcoin
98,160.82
(0.3%)
FTSE 100
8,149.27
0.79%
Nikkei 225
38,317.72
0.45%
Dow Jones
43,870.35
0.76%
Iron Ore
102.40
0.38%
USD/AUD
0.65
0.03%
Hang Seng
19,653.66
0.2%
Lithium
45.57
0.6%
Gold
2,680.00
0.3%
Copper
4.11
0.12%
Oil
70.41
0.33%
Bitcoin
98,160.82
(0.3%)
FTSE 100
8,149.27
0.79%
Nikkei 225
38,317.72
0.45%
Dow Jones
43,870.35
0.76%
Iron Ore
102.40
0.38%
USD/AUD
0.65
0.03%
Hang Seng
19,653.66
0.2%
Lithium
45.57
0.6%
Gold
2,680.00
0.3%
Copper
4.11
0.12%
Oil
70.41
0.33%
Bitcoin
98,160.82
(0.3%)
FTSE 100
8,149.27
0.79%
Nikkei 225
38,317.72
0.45%
Dow Jones
43,870.35
0.76%
Iron Ore
102.40
0.38%
USD/AUD
0.65
0.03%
Hang Seng
19,653.66
0.2%
Lithium
45.57
0.6%
Gold
2,680.00
0.3%
Copper
4.11
0.12%
Oil
70.41
0.33%
Bitcoin
98,160.82
(0.3%)
FTSE 100
8,149.27
0.79%
Nikkei 225
38,317.72
0.45%
Dow Jones
43,870.35
0.76%
Iron Ore
102.40
0.38%
USD/AUD
0.65
0.03%
Hang Seng
19,653.66
0.2%
Lithium
45.57
0.6%
Gold
2,680.00
0.3%
Copper
4.11
0.12%
Oil
70.41
0.33%
Bitcoin
98,160.82
(0.3%)
FTSE 100
8,149.27
0.79%
Nikkei 225
38,317.72
0.45%
Dow Jones
43,870.35
0.76%
Iron Ore
102.40
0.38%
USD/AUD
0.65
0.03%
Hang Seng
19,653.66
0.2%
Lithium
45.57
0.6%
Gold
2,680.00
0.3%
Copper
4.11
0.12%
Oil
70.41
0.33%
Bitcoin
98,160.82
(0.3%)
FTSE 100
8,149.27
0.79%
Nikkei 225
38,317.72
0.45%
Dow Jones
43,870.35
0.76%
Iron Ore
102.40
0.38%
USD/AUD
0.65
0.03%
Hang Seng
19,653.66
0.2%
Lithium
45.57
0.6%
Gold
2,680.00
0.3%
Copper
4.11
0.12%
Oil
70.41
0.33%
Bitcoin
98,160.82
(0.3%)
FTSE 100
8,149.27
0.79%
Nikkei 225
38,317.72
0.45%
Dow Jones
43,870.35
0.76%
Iron Ore
102.40
0.38%
USD/AUD
0.65
0.03%
Hang Seng
19,653.66
0.2%
Lithium
45.57
0.6%
Gold
2,680.00
0.3%
Copper
4.11
0.12%
Oil
70.41
0.33%
Bitcoin
98,160.82
(0.3%)
FTSE 100
8,149.27
0.79%
Nikkei 225
38,317.72
0.45%
Dow Jones
43,870.35
0.76%
Iron Ore
102.40
0.38%
USD/AUD
0.65
0.03%
Hang Seng
19,653.66
0.2%
Lithium
45.57
0.6%
Gold
2,680.00
0.3%
Copper
4.11
0.12%
Oil
70.41
0.33%
Bitcoin
98,160.82
(0.3%)
FTSE 100
8,149.27
0.79%
Nikkei 225
38,317.72
0.45%
Dow Jones
43,870.35
0.76%
Iron Ore
102.40
0.38%
USD/AUD
0.65
0.03%
Hang Seng
19,653.66
0.2%

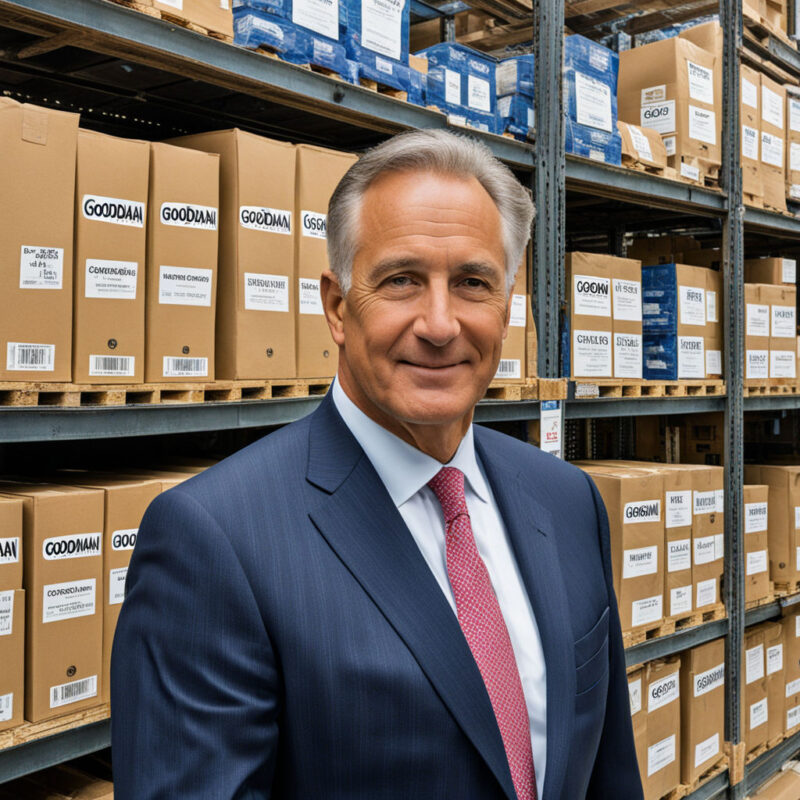
Goodman Group (GMG) maintains interim distribution amidst challenging market conditions

Goodman Group's Financial Performance for Half Year Ended 31 December 2023


Goodman Group (ASX: $GMG) has released its consolidated interim financial report for the half year ended 31 December 2023. The company reported a strong operational result with an operating profit of $1,127.4 million, representing a 28.6% increase from the prior year. However, the higher interest rates and capitalisation rates led to a net property valuation loss of $3.4 billion, resulting in a statutory loss of $220.1 million. Goodman Group's total assets under management decreased to $79.0 billion, and gearing increased to 9.0%. Despite the challenging market conditions, Goodman Group maintained its interim distribution at 15.0 cents per security, reflecting its commitment to sustainable funding for future investments.

Executive Commentary on Financial Performance and Outlook


The Group's focus on providing essential infrastructure for the digital economy is supporting a positive outlook for FY24, particularly in the data centre sector. We are actively assessing our capital allocation to provide the best risk-adjusted returns and expect continued customer and investor demand for our high-quality industrial and digital infrastructure assets. The slight decrease in the Group's development work in progress is in line with our strategic focus, and we expect to achieve full-year operating EPS growth of 11%, an increase from the previous guidance of 9%.

Overview of Financial Performance and Strategic Focus


Goodman Group (GMG) reported a strong operational result with an operating profit of $1,127.4 million, despite facing a net property valuation loss of $3.4 billion, leading to a statutory loss of $220.1 million. The company's total assets under management decreased to $79.0 billion, and gearing increased to 9.0%. Despite these challenges, Goodman Group maintained its interim distribution at 15.0 cents per security, demonstrating its commitment to sustainable funding for future investments. Looking ahead, the company expects a positive outlook for FY24, particularly in the data centre sector, and is actively assessing its capital allocation to provide the best risk-adjusted returns. Goodman Group anticipates continued customer and investor demand for its high-quality industrial and digital infrastructure assets.

0 Comments
Inline Feedbacks
View all comments
Social Media Auto Publish Powered By : XYZScripts.com

Stock Piper AI Index Coming Soon!

Join our Newsletter to gain exclusive insight and be notified once we are live.

By clicking Subscribe, you agree to our Terms & Conditions

ASX News, First And Fast.

Get all the latest market updates straight to your inbox.

By clicking Subscribe, you agree to our Terms & Conditions