Lithium
44.97
0.87%
Gold
2,709.90
0.83%
Copper
4.07
(0.07%)
Oil
71.24
1.51%
Bitcoin
98,346.88
0.59%
FTSE 100
8,262.10
1.38%
Nikkei 225
38,283.85
0.36%
Dow Jones
44,296.51
0.97%
Iron Ore
100.20
(1.77%)
USD/AUD
0.65
0%
Hang Seng
19,229.97
(1.96%)
Lithium
44.97
0.87%
Gold
2,709.90
0.83%
Copper
4.07
(0.07%)
Oil
71.24
1.51%
Bitcoin
98,346.88
0.59%
FTSE 100
8,262.10
1.38%
Nikkei 225
38,283.85
0.36%
Dow Jones
44,296.51
0.97%
Iron Ore
100.20
(1.77%)
USD/AUD
0.65
0%
Hang Seng
19,229.97
(1.96%)
Lithium
44.97
0.87%
Gold
2,709.90
0.83%
Copper
4.07
(0.07%)
Oil
71.24
1.51%
Bitcoin
98,346.88
0.59%
FTSE 100
8,262.10
1.38%
Nikkei 225
38,283.85
0.36%
Dow Jones
44,296.51
0.97%
Iron Ore
100.20
(1.77%)
USD/AUD
0.65
0%
Hang Seng
19,229.97
(1.96%)
Lithium
44.97
0.87%
Gold
2,709.90
0.83%
Copper
4.07
(0.07%)
Oil
71.24
1.51%
Bitcoin
98,346.88
0.59%
FTSE 100
8,262.10
1.38%
Nikkei 225
38,283.85
0.36%
Dow Jones
44,296.51
0.97%
Iron Ore
100.20
(1.77%)
USD/AUD
0.65
0%
Hang Seng
19,229.97
(1.96%)
Lithium
44.97
0.87%
Gold
2,709.90
0.83%
Copper
4.07
(0.07%)
Oil
71.24
1.51%
Bitcoin
98,346.88
0.59%
FTSE 100
8,262.10
1.38%
Nikkei 225
38,283.85
0.36%
Dow Jones
44,296.51
0.97%
Iron Ore
100.20
(1.77%)
USD/AUD
0.65
0%
Hang Seng
19,229.97
(1.96%)
Lithium
44.97
0.87%
Gold
2,709.90
0.83%
Copper
4.07
(0.07%)
Oil
71.24
1.51%
Bitcoin
98,346.88
0.59%
FTSE 100
8,262.10
1.38%
Nikkei 225
38,283.85
0.36%
Dow Jones
44,296.51
0.97%
Iron Ore
100.20
(1.77%)
USD/AUD
0.65
0%
Hang Seng
19,229.97
(1.96%)
Lithium
44.97
0.87%
Gold
2,709.90
0.83%
Copper
4.07
(0.07%)
Oil
71.24
1.51%
Bitcoin
98,346.88
0.59%
FTSE 100
8,262.10
1.38%
Nikkei 225
38,283.85
0.36%
Dow Jones
44,296.51
0.97%
Iron Ore
100.20
(1.77%)
USD/AUD
0.65
0%
Hang Seng
19,229.97
(1.96%)
Lithium
44.97
0.87%
Gold
2,709.90
0.83%
Copper
4.07
(0.07%)
Oil
71.24
1.51%
Bitcoin
98,346.88
0.59%
FTSE 100
8,262.10
1.38%
Nikkei 225
38,283.85
0.36%
Dow Jones
44,296.51
0.97%
Iron Ore
100.20
(1.77%)
USD/AUD
0.65
0%
Hang Seng
19,229.97
(1.96%)
Lithium
44.97
0.87%
Gold
2,709.90
0.83%
Copper
4.07
(0.07%)
Oil
71.24
1.51%
Bitcoin
98,346.88
0.59%
FTSE 100
8,262.10
1.38%
Nikkei 225
38,283.85
0.36%
Dow Jones
44,296.51
0.97%
Iron Ore
100.20
(1.77%)
USD/AUD
0.65
0%
Hang Seng
19,229.97
(1.96%)
Lithium
44.97
0.87%
Gold
2,709.90
0.83%
Copper
4.07
(0.07%)
Oil
71.24
1.51%
Bitcoin
98,346.88
0.59%
FTSE 100
8,262.10
1.38%
Nikkei 225
38,283.85
0.36%
Dow Jones
44,296.51
0.97%
Iron Ore
100.20
(1.77%)
USD/AUD
0.65
0%
Hang Seng
19,229.97
(1.96%)
Lithium
44.97
0.87%
Gold
2,709.90
0.83%
Copper
4.07
(0.07%)
Oil
71.24
1.51%
Bitcoin
98,346.88
0.59%
FTSE 100
8,262.10
1.38%
Nikkei 225
38,283.85
0.36%
Dow Jones
44,296.51
0.97%
Iron Ore
100.20
(1.77%)
USD/AUD
0.65
0%
Hang Seng
19,229.97
(1.96%)
Lithium
44.97
0.87%
Gold
2,709.90
0.83%
Copper
4.07
(0.07%)
Oil
71.24
1.51%
Bitcoin
98,346.88
0.59%
FTSE 100
8,262.10
1.38%
Nikkei 225
38,283.85
0.36%
Dow Jones
44,296.51
0.97%
Iron Ore
100.20
(1.77%)
USD/AUD
0.65
0%
Hang Seng
19,229.97
(1.96%)
Lithium
44.97
0.87%
Gold
2,709.90
0.83%
Copper
4.07
(0.07%)
Oil
71.24
1.51%
Bitcoin
98,346.88
0.59%
FTSE 100
8,262.10
1.38%
Nikkei 225
38,283.85
0.36%
Dow Jones
44,296.51
0.97%
Iron Ore
100.20
(1.77%)
USD/AUD
0.65
0%
Hang Seng
19,229.97
(1.96%)
Lithium
44.97
0.87%
Gold
2,709.90
0.83%
Copper
4.07
(0.07%)
Oil
71.24
1.51%
Bitcoin
98,346.88
0.59%
FTSE 100
8,262.10
1.38%
Nikkei 225
38,283.85
0.36%
Dow Jones
44,296.51
0.97%
Iron Ore
100.20
(1.77%)
USD/AUD
0.65
0%
Hang Seng
19,229.97
(1.96%)
Lithium
44.97
0.87%
Gold
2,709.90
0.83%
Copper
4.07
(0.07%)
Oil
71.24
1.51%
Bitcoin
98,346.88
0.59%
FTSE 100
8,262.10
1.38%
Nikkei 225
38,283.85
0.36%
Dow Jones
44,296.51
0.97%
Iron Ore
100.20
(1.77%)
USD/AUD
0.65
0%
Hang Seng
19,229.97
(1.96%)
Lithium
44.97
0.87%
Gold
2,709.90
0.83%
Copper
4.07
(0.07%)
Oil
71.24
1.51%
Bitcoin
98,346.88
0.59%
FTSE 100
8,262.10
1.38%
Nikkei 225
38,283.85
0.36%
Dow Jones
44,296.51
0.97%
Iron Ore
100.20
(1.77%)
USD/AUD
0.65
0%
Hang Seng
19,229.97
(1.96%)
Lithium
44.97
0.87%
Gold
2,709.90
0.83%
Copper
4.07
(0.07%)
Oil
71.24
1.51%
Bitcoin
98,346.88
0.59%
FTSE 100
8,262.10
1.38%
Nikkei 225
38,283.85
0.36%
Dow Jones
44,296.51
0.97%
Iron Ore
100.20
(1.77%)
USD/AUD
0.65
0%
Hang Seng
19,229.97
(1.96%)
Lithium
44.97
0.87%
Gold
2,709.90
0.83%
Copper
4.07
(0.07%)
Oil
71.24
1.51%
Bitcoin
98,346.88
0.59%
FTSE 100
8,262.10
1.38%
Nikkei 225
38,283.85
0.36%
Dow Jones
44,296.51
0.97%
Iron Ore
100.20
(1.77%)
USD/AUD
0.65
0%
Hang Seng
19,229.97
(1.96%)
Lithium
44.97
0.87%
Gold
2,709.90
0.83%
Copper
4.07
(0.07%)
Oil
71.24
1.51%
Bitcoin
98,346.88
0.59%
FTSE 100
8,262.10
1.38%
Nikkei 225
38,283.85
0.36%
Dow Jones
44,296.51
0.97%
Iron Ore
100.20
(1.77%)
USD/AUD
0.65
0%
Hang Seng
19,229.97
(1.96%)
Lithium
44.97
0.87%
Gold
2,709.90
0.83%
Copper
4.07
(0.07%)
Oil
71.24
1.51%
Bitcoin
98,346.88
0.59%
FTSE 100
8,262.10
1.38%
Nikkei 225
38,283.85
0.36%
Dow Jones
44,296.51
0.97%
Iron Ore
100.20
(1.77%)
USD/AUD
0.65
0%
Hang Seng
19,229.97
(1.96%)

Oncosil (ASX: $OSL) – Technical Analysis Points to a Promising Path Forward

The healthcare sector is brimming with exciting opportunities for investors seeking long-term growth. Among these, Oncosil (ASX: $OSL) is attracting increasing attention due to a compelling confluence of technical indicators and promising recent achievements. This analysis delves into OncoSil's technical landscape, highlighting positive signals, and explores the company's recent milestones that could pave the way for future success.

With the help of encouraging corporate developments and technical indicators, Oncosil (ASX: $OSL) has been showing a positive trajectory in the last few weeks. 

Breaking Down the Technical Highlights of Oncosil (ASX: $OSL)

Chart Patterns:

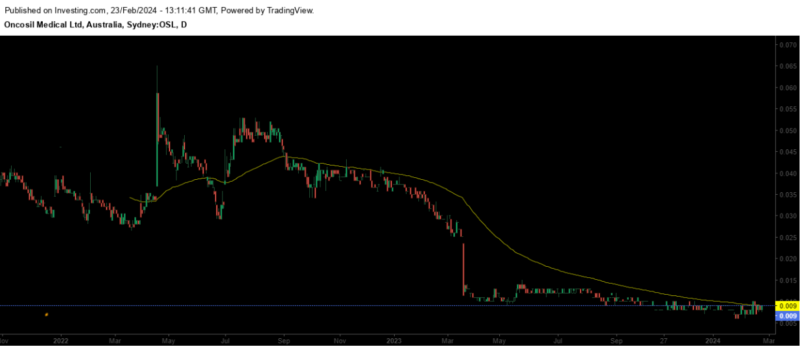
100-day EMA: OncoSil's attempt to reclaim its 100-day EMA is significant because it hasn't done so since 2022. This indicates that investor sentiment for the stock might be shifting towards a more positive outlook. If OSL can break through and consistently stay above the 100-day EMA, it could signal a bullish reversal, potentially leading to an upward trend.  
Moving Averages:

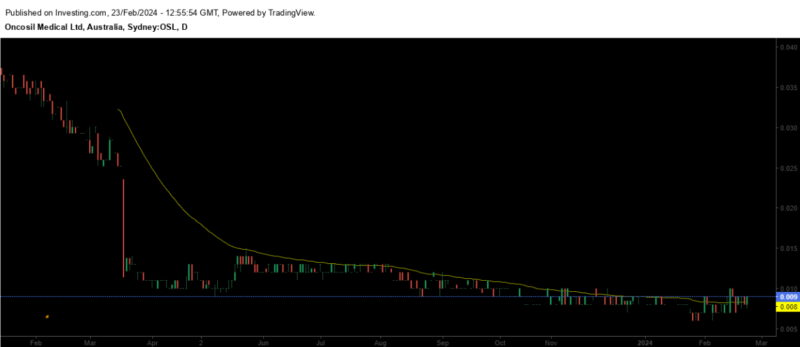
50-day EMA: OncoSil's consistent trading above its 50-day EMA highlights a short-term upward trend. This upward momentum, along with buying strength, can lead to further gains and a potential extension of the uptrend.
Relative Strength Index:

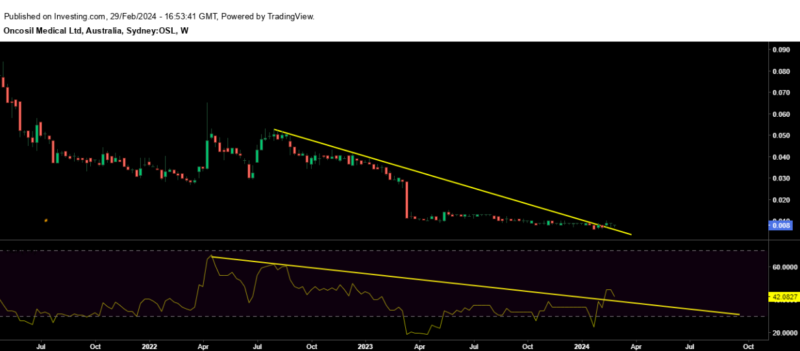
Bounce from Oversold. OncoSil's RSI rebounding from oversold levels on the monthly chart is a positive sign. Historically, when the RSI of a stock moves out of the oversold zone, it suggests a potential change in momentum from selling pressure to buying pressure. This shift from negative to positive sentiment could lead to significant price appreciation in OncoSil's stock.
Recent Achievements Fueling Oncosil's Growth Potential

Building upon the positive technical analysis, Oncosil Medical's recent achievements further bolster their potential for growth. One noteworthy development is the successful completion of patient enrollment for their Phase 2B clinical trial, which is assessing the efficacy of their lead product, OncoSil. Additionally, securing key regulatory approvals for their clinical trial programme paves the way for further development and the potential for future commercialization. These milestones not only demonstrate the company's dedication to advancing their technology but also serve as potential catalysts for investor confidence and, consequently, the stock price.

Industry Benchmarks

Further strengthening the case for Oncosil's potential growth is a comparison with established industry leaders. When we look at the historical performance of successful biotech companies like Actinogen (ASX: $ACW) and Cochlear (ASX: $COH), we observe a similar growth trajectory to Oncosil's early stages. This comparison suggests exciting possibilities for Oncosil's future, as it shares characteristics with companies that have achieved significant growth in the past. While past performance doesn't guarantee future results, it can serve as a valuable benchmark for assessing potential, and in Oncosil's case, the comparison paints a promising picture.

Investment Opportunity

In conclusion, Oncosil (ASX: $OSL) presents a compelling combination of technical strength, promising recent achievements, and industry parallels that suggest significant growth potential. The technical indicators point towards a potential shift in sentiment and momentum, while the successful completion of clinical trials and regulatory approvals demonstrate the company's progress and commitment to development. When viewed alongside the similar trajectories of successful biotech companies, Oncosil emerges as a potentially rewarding opportunity for investors seeking long-term growth in the healthcare sector.


Author

  • James Turner is a skilled economist and fund manager with extensive experience in the investment sector. Known for his strategic thinking and analytical skills, James has played a key role in the success of many investment portfolios. In addition to his financial work, he writes about market trends and shares his insights through various publications.

    View all posts
0 Comments
Inline Feedbacks
View all comments
Social Media Auto Publish Powered By : XYZScripts.com

Stock Piper AI Index Coming Soon!

Join our Newsletter to gain exclusive insight and be notified once we are live.

By clicking Subscribe, you agree to our Terms & Conditions

ASX News, First And Fast.

Get all the latest market updates straight to your inbox.

By clicking Subscribe, you agree to our Terms & Conditions