Lithium
45.57
0.6%
Gold
2,671.20
0.67%
Copper
4.11
(1.08%)
Oil
70.07
1.49%
Bitcoin
97,791.02
3.65%
FTSE 100
8,149.27
0.79%
Nikkei 225
38,026.17
(0.85%)
Dow Jones
43,870.35
0.76%
Iron Ore
102.15
1.11%
USD/AUD
0.65
0.05%
Hang Seng
19,601.11
(0.23%)
Lithium
45.57
0.6%
Gold
2,671.20
0.67%
Copper
4.11
(1.08%)
Oil
70.07
1.49%
Bitcoin
97,791.02
3.65%
FTSE 100
8,149.27
0.79%
Nikkei 225
38,026.17
(0.85%)
Dow Jones
43,870.35
0.76%
Iron Ore
102.15
1.11%
USD/AUD
0.65
0.05%
Hang Seng
19,601.11
(0.23%)
Lithium
45.57
0.6%
Gold
2,671.20
0.67%
Copper
4.11
(1.08%)
Oil
70.07
1.49%
Bitcoin
97,791.02
3.65%
FTSE 100
8,149.27
0.79%
Nikkei 225
38,026.17
(0.85%)
Dow Jones
43,870.35
0.76%
Iron Ore
102.15
1.11%
USD/AUD
0.65
0.05%
Hang Seng
19,601.11
(0.23%)
Lithium
45.57
0.6%
Gold
2,671.20
0.67%
Copper
4.11
(1.08%)
Oil
70.07
1.49%
Bitcoin
97,791.02
3.65%
FTSE 100
8,149.27
0.79%
Nikkei 225
38,026.17
(0.85%)
Dow Jones
43,870.35
0.76%
Iron Ore
102.15
1.11%
USD/AUD
0.65
0.05%
Hang Seng
19,601.11
(0.23%)
Lithium
45.57
0.6%
Gold
2,671.20
0.67%
Copper
4.11
(1.08%)
Oil
70.07
1.49%
Bitcoin
97,791.02
3.65%
FTSE 100
8,149.27
0.79%
Nikkei 225
38,026.17
(0.85%)
Dow Jones
43,870.35
0.76%
Iron Ore
102.15
1.11%
USD/AUD
0.65
0.05%
Hang Seng
19,601.11
(0.23%)
Lithium
45.57
0.6%
Gold
2,671.20
0.67%
Copper
4.11
(1.08%)
Oil
70.07
1.49%
Bitcoin
97,791.02
3.65%
FTSE 100
8,149.27
0.79%
Nikkei 225
38,026.17
(0.85%)
Dow Jones
43,870.35
0.76%
Iron Ore
102.15
1.11%
USD/AUD
0.65
0.05%
Hang Seng
19,601.11
(0.23%)
Lithium
45.57
0.6%
Gold
2,671.20
0.67%
Copper
4.11
(1.08%)
Oil
70.07
1.49%
Bitcoin
97,791.02
3.65%
FTSE 100
8,149.27
0.79%
Nikkei 225
38,026.17
(0.85%)
Dow Jones
43,870.35
0.76%
Iron Ore
102.15
1.11%
USD/AUD
0.65
0.05%
Hang Seng
19,601.11
(0.23%)
Lithium
45.57
0.6%
Gold
2,671.20
0.67%
Copper
4.11
(1.08%)
Oil
70.07
1.49%
Bitcoin
97,791.02
3.65%
FTSE 100
8,149.27
0.79%
Nikkei 225
38,026.17
(0.85%)
Dow Jones
43,870.35
0.76%
Iron Ore
102.15
1.11%
USD/AUD
0.65
0.05%
Hang Seng
19,601.11
(0.23%)
Lithium
45.57
0.6%
Gold
2,671.20
0.67%
Copper
4.11
(1.08%)
Oil
70.07
1.49%
Bitcoin
97,791.02
3.65%
FTSE 100
8,149.27
0.79%
Nikkei 225
38,026.17
(0.85%)
Dow Jones
43,870.35
0.76%
Iron Ore
102.15
1.11%
USD/AUD
0.65
0.05%
Hang Seng
19,601.11
(0.23%)
Lithium
45.57
0.6%
Gold
2,671.20
0.67%
Copper
4.11
(1.08%)
Oil
70.07
1.49%
Bitcoin
97,791.02
3.65%
FTSE 100
8,149.27
0.79%
Nikkei 225
38,026.17
(0.85%)
Dow Jones
43,870.35
0.76%
Iron Ore
102.15
1.11%
USD/AUD
0.65
0.05%
Hang Seng
19,601.11
(0.23%)
Lithium
45.57
0.6%
Gold
2,671.20
0.67%
Copper
4.11
(1.08%)
Oil
70.07
1.49%
Bitcoin
97,791.02
3.65%
FTSE 100
8,149.27
0.79%
Nikkei 225
38,026.17
(0.85%)
Dow Jones
43,870.35
0.76%
Iron Ore
102.15
1.11%
USD/AUD
0.65
0.05%
Hang Seng
19,601.11
(0.23%)
Lithium
45.57
0.6%
Gold
2,671.20
0.67%
Copper
4.11
(1.08%)
Oil
70.07
1.49%
Bitcoin
97,791.02
3.65%
FTSE 100
8,149.27
0.79%
Nikkei 225
38,026.17
(0.85%)
Dow Jones
43,870.35
0.76%
Iron Ore
102.15
1.11%
USD/AUD
0.65
0.05%
Hang Seng
19,601.11
(0.23%)
Lithium
45.57
0.6%
Gold
2,671.20
0.67%
Copper
4.11
(1.08%)
Oil
70.07
1.49%
Bitcoin
97,791.02
3.65%
FTSE 100
8,149.27
0.79%
Nikkei 225
38,026.17
(0.85%)
Dow Jones
43,870.35
0.76%
Iron Ore
102.15
1.11%
USD/AUD
0.65
0.05%
Hang Seng
19,601.11
(0.23%)
Lithium
45.57
0.6%
Gold
2,671.20
0.67%
Copper
4.11
(1.08%)
Oil
70.07
1.49%
Bitcoin
97,791.02
3.65%
FTSE 100
8,149.27
0.79%
Nikkei 225
38,026.17
(0.85%)
Dow Jones
43,870.35
0.76%
Iron Ore
102.15
1.11%
USD/AUD
0.65
0.05%
Hang Seng
19,601.11
(0.23%)
Lithium
45.57
0.6%
Gold
2,671.20
0.67%
Copper
4.11
(1.08%)
Oil
70.07
1.49%
Bitcoin
97,791.02
3.65%
FTSE 100
8,149.27
0.79%
Nikkei 225
38,026.17
(0.85%)
Dow Jones
43,870.35
0.76%
Iron Ore
102.15
1.11%
USD/AUD
0.65
0.05%
Hang Seng
19,601.11
(0.23%)
Lithium
45.57
0.6%
Gold
2,671.20
0.67%
Copper
4.11
(1.08%)
Oil
70.07
1.49%
Bitcoin
97,791.02
3.65%
FTSE 100
8,149.27
0.79%
Nikkei 225
38,026.17
(0.85%)
Dow Jones
43,870.35
0.76%
Iron Ore
102.15
1.11%
USD/AUD
0.65
0.05%
Hang Seng
19,601.11
(0.23%)
Lithium
45.57
0.6%
Gold
2,671.20
0.67%
Copper
4.11
(1.08%)
Oil
70.07
1.49%
Bitcoin
97,791.02
3.65%
FTSE 100
8,149.27
0.79%
Nikkei 225
38,026.17
(0.85%)
Dow Jones
43,870.35
0.76%
Iron Ore
102.15
1.11%
USD/AUD
0.65
0.05%
Hang Seng
19,601.11
(0.23%)
Lithium
45.57
0.6%
Gold
2,671.20
0.67%
Copper
4.11
(1.08%)
Oil
70.07
1.49%
Bitcoin
97,791.02
3.65%
FTSE 100
8,149.27
0.79%
Nikkei 225
38,026.17
(0.85%)
Dow Jones
43,870.35
0.76%
Iron Ore
102.15
1.11%
USD/AUD
0.65
0.05%
Hang Seng
19,601.11
(0.23%)
Lithium
45.57
0.6%
Gold
2,671.20
0.67%
Copper
4.11
(1.08%)
Oil
70.07
1.49%
Bitcoin
97,791.02
3.65%
FTSE 100
8,149.27
0.79%
Nikkei 225
38,026.17
(0.85%)
Dow Jones
43,870.35
0.76%
Iron Ore
102.15
1.11%
USD/AUD
0.65
0.05%
Hang Seng
19,601.11
(0.23%)
Lithium
45.57
0.6%
Gold
2,671.20
0.67%
Copper
4.11
(1.08%)
Oil
70.07
1.49%
Bitcoin
97,791.02
3.65%
FTSE 100
8,149.27
0.79%
Nikkei 225
38,026.17
(0.85%)
Dow Jones
43,870.35
0.76%
Iron Ore
102.15
1.11%
USD/AUD
0.65
0.05%
Hang Seng
19,601.11
(0.23%)

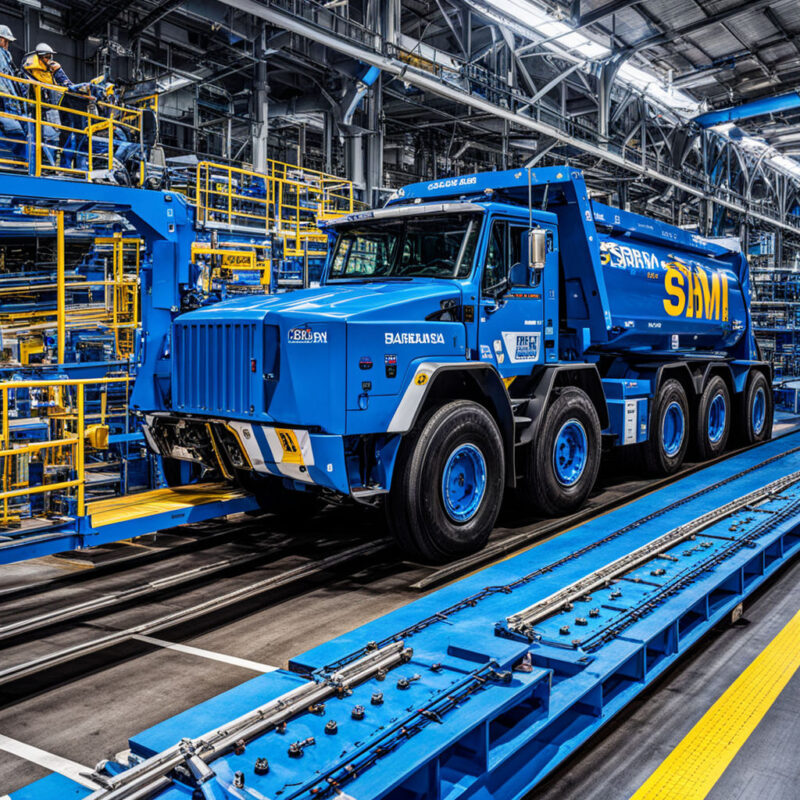
St Barbara (ASX: $SBM) reports q3 production up 33%

St Barbara Q3 FY24 Production Update


St Barbara Limited (ASX: $SBM) reported a 33% increase in gold production for the March 2024 quarter (Q3 FY24) at its Simberi mine. The company produced 17,257 ounces of gold with an average milled grade of 1.63 g/t Au and gold recovery of 77%. Additionally, gold sales for the quarter reached 18,016 ounces at an average realized gold price of A$3,178 per ounce. The total cash balance as of 31 March 2024 was A$218 million, showing an increase of $4 million from the previous quarter, with no debt.

Executive Commentary on Q3 FY24 Production


Simberi again improved during the March quarter with gold production increasing 33% compared to the December quarter. As previously highlighted in the December quarterly report, production guidance for Simberi was weighted to H2 FY24 and we remain on track with this solid quarter.

Summary of Q3 FY24 Production Update


St Barbara (ASX: $SBM) reported a significant 33% increase in gold production at its Simberi mine for the March 2024 quarter. The company achieved a production of 17,257 ounces of gold with an average milled grade of 1.63 g/t Au and gold recovery of 77%. Despite challenges in mill and rope conveyor availability, the mined grade improved during the quarter. The total cash balance increased to A$218 million, reflecting improved operating cash flow and receipt of a tax refund in the Canadian subsidiary. The Managing Director and CEO, Andrew Strelein, expressed satisfaction with the performance, emphasizing that the production guidance for Simberi remains on track for H2 FY24. Further details on operations, production costs, and cash flow will be provided in the upcoming quarterly report.
ST BARBARA LIMITED
SBM | ASX | Materials
0.350(+0%)
At close 20/11 (AEDT)
Market cap
$317.0M
Volume
5,126,126
DY Yield
PE Ratio
52 Week Range
0.1375 - 0.5
1YR Return
N / A

0 Comments
Inline Feedbacks
View all comments
Social Media Auto Publish Powered By : XYZScripts.com

Stock Piper AI Index Coming Soon!

Join our Newsletter to gain exclusive insight and be notified once we are live.

By clicking Subscribe, you agree to our Terms & Conditions

ASX News, First And Fast.

Get all the latest market updates straight to your inbox.

By clicking Subscribe, you agree to our Terms & Conditions