Lithium
45.60
0.66%
Gold
2,673.70
0.76%
Copper
4.11
(0.95%)
Oil
69.86
1.19%
Bitcoin
98,299.71
4.19%
FTSE 100
8,149.27
0.79%
Nikkei 225
38,026.17
(0.85%)
Dow Jones
43,934.22
0.91%
Iron Ore
102.15
1.11%
USD/AUD
0.65
0.16%
Hang Seng
19,601.11
(0.23%)
Lithium
45.60
0.66%
Gold
2,673.70
0.76%
Copper
4.11
(0.95%)
Oil
69.86
1.19%
Bitcoin
98,299.71
4.19%
FTSE 100
8,149.27
0.79%
Nikkei 225
38,026.17
(0.85%)
Dow Jones
43,934.22
0.91%
Iron Ore
102.15
1.11%
USD/AUD
0.65
0.16%
Hang Seng
19,601.11
(0.23%)
Lithium
45.60
0.66%
Gold
2,673.70
0.76%
Copper
4.11
(0.95%)
Oil
69.86
1.19%
Bitcoin
98,299.71
4.19%
FTSE 100
8,149.27
0.79%
Nikkei 225
38,026.17
(0.85%)
Dow Jones
43,934.22
0.91%
Iron Ore
102.15
1.11%
USD/AUD
0.65
0.16%
Hang Seng
19,601.11
(0.23%)
Lithium
45.60
0.66%
Gold
2,673.70
0.76%
Copper
4.11
(0.95%)
Oil
69.86
1.19%
Bitcoin
98,299.71
4.19%
FTSE 100
8,149.27
0.79%
Nikkei 225
38,026.17
(0.85%)
Dow Jones
43,934.22
0.91%
Iron Ore
102.15
1.11%
USD/AUD
0.65
0.16%
Hang Seng
19,601.11
(0.23%)
Lithium
45.60
0.66%
Gold
2,673.70
0.76%
Copper
4.11
(0.95%)
Oil
69.86
1.19%
Bitcoin
98,299.71
4.19%
FTSE 100
8,149.27
0.79%
Nikkei 225
38,026.17
(0.85%)
Dow Jones
43,934.22
0.91%
Iron Ore
102.15
1.11%
USD/AUD
0.65
0.16%
Hang Seng
19,601.11
(0.23%)
Lithium
45.60
0.66%
Gold
2,673.70
0.76%
Copper
4.11
(0.95%)
Oil
69.86
1.19%
Bitcoin
98,299.71
4.19%
FTSE 100
8,149.27
0.79%
Nikkei 225
38,026.17
(0.85%)
Dow Jones
43,934.22
0.91%
Iron Ore
102.15
1.11%
USD/AUD
0.65
0.16%
Hang Seng
19,601.11
(0.23%)
Lithium
45.60
0.66%
Gold
2,673.70
0.76%
Copper
4.11
(0.95%)
Oil
69.86
1.19%
Bitcoin
98,299.71
4.19%
FTSE 100
8,149.27
0.79%
Nikkei 225
38,026.17
(0.85%)
Dow Jones
43,934.22
0.91%
Iron Ore
102.15
1.11%
USD/AUD
0.65
0.16%
Hang Seng
19,601.11
(0.23%)
Lithium
45.60
0.66%
Gold
2,673.70
0.76%
Copper
4.11
(0.95%)
Oil
69.86
1.19%
Bitcoin
98,299.71
4.19%
FTSE 100
8,149.27
0.79%
Nikkei 225
38,026.17
(0.85%)
Dow Jones
43,934.22
0.91%
Iron Ore
102.15
1.11%
USD/AUD
0.65
0.16%
Hang Seng
19,601.11
(0.23%)
Lithium
45.60
0.66%
Gold
2,673.70
0.76%
Copper
4.11
(0.95%)
Oil
69.86
1.19%
Bitcoin
98,299.71
4.19%
FTSE 100
8,149.27
0.79%
Nikkei 225
38,026.17
(0.85%)
Dow Jones
43,934.22
0.91%
Iron Ore
102.15
1.11%
USD/AUD
0.65
0.16%
Hang Seng
19,601.11
(0.23%)
Lithium
45.60
0.66%
Gold
2,673.70
0.76%
Copper
4.11
(0.95%)
Oil
69.86
1.19%
Bitcoin
98,299.71
4.19%
FTSE 100
8,149.27
0.79%
Nikkei 225
38,026.17
(0.85%)
Dow Jones
43,934.22
0.91%
Iron Ore
102.15
1.11%
USD/AUD
0.65
0.16%
Hang Seng
19,601.11
(0.23%)
Lithium
45.60
0.66%
Gold
2,673.70
0.76%
Copper
4.11
(0.95%)
Oil
69.86
1.19%
Bitcoin
98,299.71
4.19%
FTSE 100
8,149.27
0.79%
Nikkei 225
38,026.17
(0.85%)
Dow Jones
43,934.22
0.91%
Iron Ore
102.15
1.11%
USD/AUD
0.65
0.16%
Hang Seng
19,601.11
(0.23%)
Lithium
45.60
0.66%
Gold
2,673.70
0.76%
Copper
4.11
(0.95%)
Oil
69.86
1.19%
Bitcoin
98,299.71
4.19%
FTSE 100
8,149.27
0.79%
Nikkei 225
38,026.17
(0.85%)
Dow Jones
43,934.22
0.91%
Iron Ore
102.15
1.11%
USD/AUD
0.65
0.16%
Hang Seng
19,601.11
(0.23%)
Lithium
45.60
0.66%
Gold
2,673.70
0.76%
Copper
4.11
(0.95%)
Oil
69.86
1.19%
Bitcoin
98,299.71
4.19%
FTSE 100
8,149.27
0.79%
Nikkei 225
38,026.17
(0.85%)
Dow Jones
43,934.22
0.91%
Iron Ore
102.15
1.11%
USD/AUD
0.65
0.16%
Hang Seng
19,601.11
(0.23%)
Lithium
45.60
0.66%
Gold
2,673.70
0.76%
Copper
4.11
(0.95%)
Oil
69.86
1.19%
Bitcoin
98,299.71
4.19%
FTSE 100
8,149.27
0.79%
Nikkei 225
38,026.17
(0.85%)
Dow Jones
43,934.22
0.91%
Iron Ore
102.15
1.11%
USD/AUD
0.65
0.16%
Hang Seng
19,601.11
(0.23%)
Lithium
45.60
0.66%
Gold
2,673.70
0.76%
Copper
4.11
(0.95%)
Oil
69.86
1.19%
Bitcoin
98,299.71
4.19%
FTSE 100
8,149.27
0.79%
Nikkei 225
38,026.17
(0.85%)
Dow Jones
43,934.22
0.91%
Iron Ore
102.15
1.11%
USD/AUD
0.65
0.16%
Hang Seng
19,601.11
(0.23%)
Lithium
45.60
0.66%
Gold
2,673.70
0.76%
Copper
4.11
(0.95%)
Oil
69.86
1.19%
Bitcoin
98,299.71
4.19%
FTSE 100
8,149.27
0.79%
Nikkei 225
38,026.17
(0.85%)
Dow Jones
43,934.22
0.91%
Iron Ore
102.15
1.11%
USD/AUD
0.65
0.16%
Hang Seng
19,601.11
(0.23%)
Lithium
45.60
0.66%
Gold
2,673.70
0.76%
Copper
4.11
(0.95%)
Oil
69.86
1.19%
Bitcoin
98,299.71
4.19%
FTSE 100
8,149.27
0.79%
Nikkei 225
38,026.17
(0.85%)
Dow Jones
43,934.22
0.91%
Iron Ore
102.15
1.11%
USD/AUD
0.65
0.16%
Hang Seng
19,601.11
(0.23%)
Lithium
45.60
0.66%
Gold
2,673.70
0.76%
Copper
4.11
(0.95%)
Oil
69.86
1.19%
Bitcoin
98,299.71
4.19%
FTSE 100
8,149.27
0.79%
Nikkei 225
38,026.17
(0.85%)
Dow Jones
43,934.22
0.91%
Iron Ore
102.15
1.11%
USD/AUD
0.65
0.16%
Hang Seng
19,601.11
(0.23%)
Lithium
45.60
0.66%
Gold
2,673.70
0.76%
Copper
4.11
(0.95%)
Oil
69.86
1.19%
Bitcoin
98,299.71
4.19%
FTSE 100
8,149.27
0.79%
Nikkei 225
38,026.17
(0.85%)
Dow Jones
43,934.22
0.91%
Iron Ore
102.15
1.11%
USD/AUD
0.65
0.16%
Hang Seng
19,601.11
(0.23%)
Lithium
45.60
0.66%
Gold
2,673.70
0.76%
Copper
4.11
(0.95%)
Oil
69.86
1.19%
Bitcoin
98,299.71
4.19%
FTSE 100
8,149.27
0.79%
Nikkei 225
38,026.17
(0.85%)
Dow Jones
43,934.22
0.91%
Iron Ore
102.15
1.11%
USD/AUD
0.65
0.16%
Hang Seng
19,601.11
(0.23%)

Red Mountain Mining (ASX: $RMX) reports significant gold assay results

Key assay results from Flicka Lake prospect


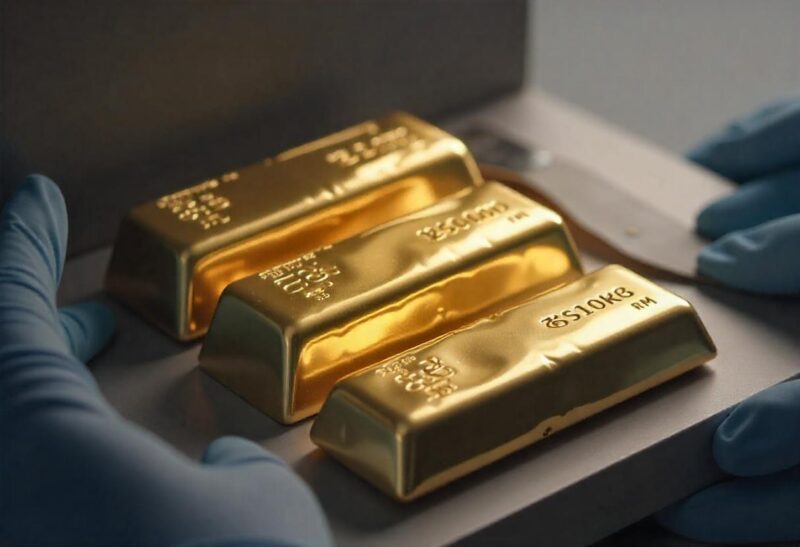
Red Mountain Mining (ASX:RMX) has reported significant gold assay results from its Flicka Lake prospect in Ontario, Canada. The company collected 91 rock chip samples in September 2024, revealing high-grade gold values in the Flicka Zone. Notable concentrations were found from Vein #2 and Vein #3, with values of 24.2 ppm and 19.4 ppm respectively for Vein #2, and a peak value of 9.35 ppm for Vein #3.

Summary and future exploration plans


Red Mountain Mining (ASX:RMX) announced notable gold assay results from its 100% owned Flicka Lake prospect in Ontario, Canada, with samples showing high gold grades. The results, consistent with historical data, indicate potential for significant mineralization, comparable to historical mines like the Golden Patricia Mine. RMX is focused on further exploration, planning to evaluate soil geochemistry and rock chip sample results to prioritize future drilling activities in 2025. The company aims to explore the underexplored southwest portion of the Belt, with soil assay results expected by November 2024, to enhance its strategic positioning in gold and battery metals exploration across Canada, Australia, and the USA.

Executive commentary on exploration results


These results are consistent with historical findings by Troon Ventures and suggest the potential for high-grade mineralization along the shear system.

RED MOUNTAIN MINING LIMITED
RMX | ASX | Materials
0.0110(+0%)
At close 20/11 (AEDT)
Market cap
$4.3M
Volume
974,279
DY Yield
PE Ratio
52 Week Range
0.008 - 0.034999
1YR Return
N / A

0 Comments
Inline Feedbacks
View all comments
Social Media Auto Publish Powered By : XYZScripts.com

Stock Piper AI Index Coming Soon!

Join our Newsletter to gain exclusive insight and be notified once we are live.

By clicking Subscribe, you agree to our Terms & Conditions

ASX News, First And Fast.

Get all the latest market updates straight to your inbox.

By clicking Subscribe, you agree to our Terms & Conditions