Iron Ore
101.25
(0.04%)
Lithium
42.74
1.28%
Gold
2,633.50
0.16%
Copper
4.10
0.2%
Oil
70.17
0.88%
Bitcoin
98,843.06
0.22%
USD/AUD
0.62
0.2%
FTSE 100
8,137.00
0.42%
Nikkei 225
39,130.43
(0.1%)
Dow Jones
43,297.03
0.89%
Hang Seng
20,098.29
0.94%
Iron Ore
101.25
(0.04%)
Lithium
42.74
1.28%
Gold
2,633.50
0.16%
Copper
4.10
0.2%
Oil
70.17
0.88%
Bitcoin
98,843.06
0.22%
USD/AUD
0.62
0.2%
FTSE 100
8,137.00
0.42%
Nikkei 225
39,130.43
(0.1%)
Dow Jones
43,297.03
0.89%
Hang Seng
20,098.29
0.94%
Iron Ore
101.25
(0.04%)
Lithium
42.74
1.28%
Gold
2,633.50
0.16%
Copper
4.10
0.2%
Oil
70.17
0.88%
Bitcoin
98,843.06
0.22%
USD/AUD
0.62
0.2%
FTSE 100
8,137.00
0.42%
Nikkei 225
39,130.43
(0.1%)
Dow Jones
43,297.03
0.89%
Hang Seng
20,098.29
0.94%
Iron Ore
101.25
(0.04%)
Lithium
42.74
1.28%
Gold
2,633.50
0.16%
Copper
4.10
0.2%
Oil
70.17
0.88%
Bitcoin
98,843.06
0.22%
USD/AUD
0.62
0.2%
FTSE 100
8,137.00
0.42%
Nikkei 225
39,130.43
(0.1%)
Dow Jones
43,297.03
0.89%
Hang Seng
20,098.29
0.94%
Iron Ore
101.25
(0.04%)
Lithium
42.74
1.28%
Gold
2,633.50
0.16%
Copper
4.10
0.2%
Oil
70.17
0.88%
Bitcoin
98,843.06
0.22%
USD/AUD
0.62
0.2%
FTSE 100
8,137.00
0.42%
Nikkei 225
39,130.43
(0.1%)
Dow Jones
43,297.03
0.89%
Hang Seng
20,098.29
0.94%
Iron Ore
101.25
(0.04%)
Lithium
42.74
1.28%
Gold
2,633.50
0.16%
Copper
4.10
0.2%
Oil
70.17
0.88%
Bitcoin
98,843.06
0.22%
USD/AUD
0.62
0.2%
FTSE 100
8,137.00
0.42%
Nikkei 225
39,130.43
(0.1%)
Dow Jones
43,297.03
0.89%
Hang Seng
20,098.29
0.94%
Iron Ore
101.25
(0.04%)
Lithium
42.74
1.28%
Gold
2,633.50
0.16%
Copper
4.10
0.2%
Oil
70.17
0.88%
Bitcoin
98,843.06
0.22%
USD/AUD
0.62
0.2%
FTSE 100
8,137.00
0.42%
Nikkei 225
39,130.43
(0.1%)
Dow Jones
43,297.03
0.89%
Hang Seng
20,098.29
0.94%
Iron Ore
101.25
(0.04%)
Lithium
42.74
1.28%
Gold
2,633.50
0.16%
Copper
4.10
0.2%
Oil
70.17
0.88%
Bitcoin
98,843.06
0.22%
USD/AUD
0.62
0.2%
FTSE 100
8,137.00
0.42%
Nikkei 225
39,130.43
(0.1%)
Dow Jones
43,297.03
0.89%
Hang Seng
20,098.29
0.94%
Iron Ore
101.25
(0.04%)
Lithium
42.74
1.28%
Gold
2,633.50
0.16%
Copper
4.10
0.2%
Oil
70.17
0.88%
Bitcoin
98,843.06
0.22%
USD/AUD
0.62
0.2%
FTSE 100
8,137.00
0.42%
Nikkei 225
39,130.43
(0.1%)
Dow Jones
43,297.03
0.89%
Hang Seng
20,098.29
0.94%
Iron Ore
101.25
(0.04%)
Lithium
42.74
1.28%
Gold
2,633.50
0.16%
Copper
4.10
0.2%
Oil
70.17
0.88%
Bitcoin
98,843.06
0.22%
USD/AUD
0.62
0.2%
FTSE 100
8,137.00
0.42%
Nikkei 225
39,130.43
(0.1%)
Dow Jones
43,297.03
0.89%
Hang Seng
20,098.29
0.94%
Iron Ore
101.25
(0.04%)
Lithium
42.74
1.28%
Gold
2,633.50
0.16%
Copper
4.10
0.2%
Oil
70.17
0.88%
Bitcoin
98,843.06
0.22%
USD/AUD
0.62
0.2%
FTSE 100
8,137.00
0.42%
Nikkei 225
39,130.43
(0.1%)
Dow Jones
43,297.03
0.89%
Hang Seng
20,098.29
0.94%
Iron Ore
101.25
(0.04%)
Lithium
42.74
1.28%
Gold
2,633.50
0.16%
Copper
4.10
0.2%
Oil
70.17
0.88%
Bitcoin
98,843.06
0.22%
USD/AUD
0.62
0.2%
FTSE 100
8,137.00
0.42%
Nikkei 225
39,130.43
(0.1%)
Dow Jones
43,297.03
0.89%
Hang Seng
20,098.29
0.94%
Iron Ore
101.25
(0.04%)
Lithium
42.74
1.28%
Gold
2,633.50
0.16%
Copper
4.10
0.2%
Oil
70.17
0.88%
Bitcoin
98,843.06
0.22%
USD/AUD
0.62
0.2%
FTSE 100
8,137.00
0.42%
Nikkei 225
39,130.43
(0.1%)
Dow Jones
43,297.03
0.89%
Hang Seng
20,098.29
0.94%
Iron Ore
101.25
(0.04%)
Lithium
42.74
1.28%
Gold
2,633.50
0.16%
Copper
4.10
0.2%
Oil
70.17
0.88%
Bitcoin
98,843.06
0.22%
USD/AUD
0.62
0.2%
FTSE 100
8,137.00
0.42%
Nikkei 225
39,130.43
(0.1%)
Dow Jones
43,297.03
0.89%
Hang Seng
20,098.29
0.94%
Iron Ore
101.25
(0.04%)
Lithium
42.74
1.28%
Gold
2,633.50
0.16%
Copper
4.10
0.2%
Oil
70.17
0.88%
Bitcoin
98,843.06
0.22%
USD/AUD
0.62
0.2%
FTSE 100
8,137.00
0.42%
Nikkei 225
39,130.43
(0.1%)
Dow Jones
43,297.03
0.89%
Hang Seng
20,098.29
0.94%
Iron Ore
101.25
(0.04%)
Lithium
42.74
1.28%
Gold
2,633.50
0.16%
Copper
4.10
0.2%
Oil
70.17
0.88%
Bitcoin
98,843.06
0.22%
USD/AUD
0.62
0.2%
FTSE 100
8,137.00
0.42%
Nikkei 225
39,130.43
(0.1%)
Dow Jones
43,297.03
0.89%
Hang Seng
20,098.29
0.94%
Iron Ore
101.25
(0.04%)
Lithium
42.74
1.28%
Gold
2,633.50
0.16%
Copper
4.10
0.2%
Oil
70.17
0.88%
Bitcoin
98,843.06
0.22%
USD/AUD
0.62
0.2%
FTSE 100
8,137.00
0.42%
Nikkei 225
39,130.43
(0.1%)
Dow Jones
43,297.03
0.89%
Hang Seng
20,098.29
0.94%
Iron Ore
101.25
(0.04%)
Lithium
42.74
1.28%
Gold
2,633.50
0.16%
Copper
4.10
0.2%
Oil
70.17
0.88%
Bitcoin
98,843.06
0.22%
USD/AUD
0.62
0.2%
FTSE 100
8,137.00
0.42%
Nikkei 225
39,130.43
(0.1%)
Dow Jones
43,297.03
0.89%
Hang Seng
20,098.29
0.94%
Iron Ore
101.25
(0.04%)
Lithium
42.74
1.28%
Gold
2,633.50
0.16%
Copper
4.10
0.2%
Oil
70.17
0.88%
Bitcoin
98,843.06
0.22%
USD/AUD
0.62
0.2%
FTSE 100
8,137.00
0.42%
Nikkei 225
39,130.43
(0.1%)
Dow Jones
43,297.03
0.89%
Hang Seng
20,098.29
0.94%
Iron Ore
101.25
(0.04%)
Lithium
42.74
1.28%
Gold
2,633.50
0.16%
Copper
4.10
0.2%
Oil
70.17
0.88%
Bitcoin
98,843.06
0.22%
USD/AUD
0.62
0.2%
FTSE 100
8,137.00
0.42%
Nikkei 225
39,130.43
(0.1%)
Dow Jones
43,297.03
0.89%
Hang Seng
20,098.29
0.94%

Santana Minerals (ASX: $SMI) reports promising assay results from CIT deposit

Santana Minerals' CIT deposit drilling results


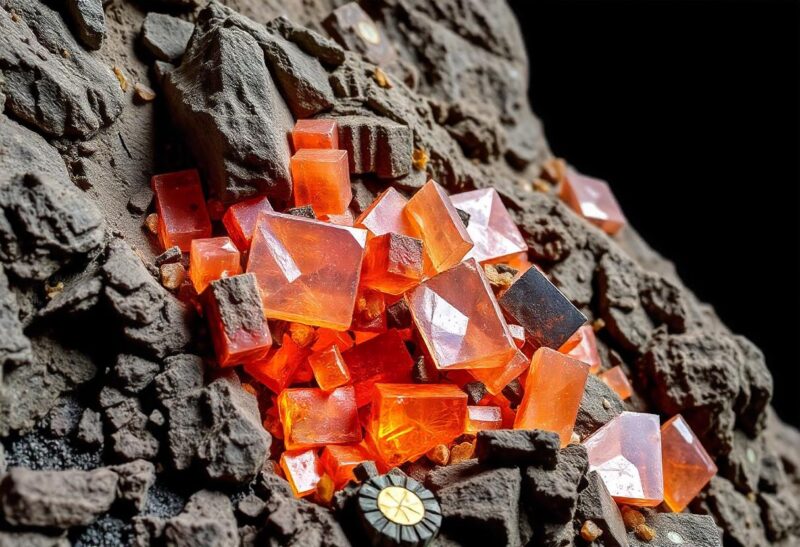
Santana Minerals (ASX:SMI) has announced notable assay results from its recent drilling program at the Come-In-Time (CIT) deposit. Located 1.3km west of the Rise and Shine (RAS) orebody, these findings reveal high-grade gold intersections that could improve resource quality and support integration into the RAS operation.

Overview of CIT deposit findings and plans


Santana Minerals' assay results from the CIT deposit show promising high-grade intersections, potentially enhancing its resource quality. The CIT deposit, with a previous Inferred Mineral Resource Estimate of 3.2 million tonnes at 0.80 g/t Au, now boasts high-grade findings such as 11.0m at 9.5 g/t Au, indicating potential for resource upgrade. The ongoing drilling aims to bolster this resource to the Indicated category. This strategic development could integrate CIT as a supplementary feed to the RAS operation, optimizing resource utilization. Future plans include extensive drilling and studies to support pre-feasibility studies, with a focus on understanding the structural and geological complexities of the deposit.

Executive insights on CIT assay results


The subtle structural and alteration types at CIT have posed challenges, but identifying high-grade zones similar to RAS has significant potential impact.

SANTANA MINERALS LIMITED
SMI | ASX | Materials
0.45-0.01(-2.17%)
At close 24/12 (AEDT)
Market cap
$289.8M
Volume
346,531
DY Yield
PE Ratio
52 Week Range
0.31 - 0.82
1YR Return
N / A

0 Comments
Inline Feedbacks
View all comments
Social Media Auto Publish Powered By : XYZScripts.com

Stock Piper AI Index Coming Soon!

Join our Newsletter to gain exclusive insight and be notified once we are live.

By clicking Subscribe, you agree to our Terms & Conditions

ASX News, First And Fast.

Get all the latest market updates straight to your inbox.

By clicking Subscribe, you agree to our Terms & Conditions