Lithium
45.28
0.49%
Gold
2,670.70
0.65%
Copper
4.16
0.1%
Oil
69.67
0.17%
Bitcoin
97,050.26
2.86%
FTSE 100
8,077.97
(0.09%)
Nikkei 225
38,026.17
(0.85%)
Dow Jones
43,408.47
0.26%
Iron Ore
102.20
1.16%
USD/AUD
0.65
0.2%
Hang Seng
19,601.11
(0.23%)
Lithium
45.28
0.49%
Gold
2,670.70
0.65%
Copper
4.16
0.1%
Oil
69.67
0.17%
Bitcoin
97,050.26
2.86%
FTSE 100
8,077.97
(0.09%)
Nikkei 225
38,026.17
(0.85%)
Dow Jones
43,408.47
0.26%
Iron Ore
102.20
1.16%
USD/AUD
0.65
0.2%
Hang Seng
19,601.11
(0.23%)
Lithium
45.28
0.49%
Gold
2,670.70
0.65%
Copper
4.16
0.1%
Oil
69.67
0.17%
Bitcoin
97,050.26
2.86%
FTSE 100
8,077.97
(0.09%)
Nikkei 225
38,026.17
(0.85%)
Dow Jones
43,408.47
0.26%
Iron Ore
102.20
1.16%
USD/AUD
0.65
0.2%
Hang Seng
19,601.11
(0.23%)
Lithium
45.28
0.49%
Gold
2,670.70
0.65%
Copper
4.16
0.1%
Oil
69.67
0.17%
Bitcoin
97,050.26
2.86%
FTSE 100
8,077.97
(0.09%)
Nikkei 225
38,026.17
(0.85%)
Dow Jones
43,408.47
0.26%
Iron Ore
102.20
1.16%
USD/AUD
0.65
0.2%
Hang Seng
19,601.11
(0.23%)
Lithium
45.28
0.49%
Gold
2,670.70
0.65%
Copper
4.16
0.1%
Oil
69.67
0.17%
Bitcoin
97,050.26
2.86%
FTSE 100
8,077.97
(0.09%)
Nikkei 225
38,026.17
(0.85%)
Dow Jones
43,408.47
0.26%
Iron Ore
102.20
1.16%
USD/AUD
0.65
0.2%
Hang Seng
19,601.11
(0.23%)
Lithium
45.28
0.49%
Gold
2,670.70
0.65%
Copper
4.16
0.1%
Oil
69.67
0.17%
Bitcoin
97,050.26
2.86%
FTSE 100
8,077.97
(0.09%)
Nikkei 225
38,026.17
(0.85%)
Dow Jones
43,408.47
0.26%
Iron Ore
102.20
1.16%
USD/AUD
0.65
0.2%
Hang Seng
19,601.11
(0.23%)
Lithium
45.28
0.49%
Gold
2,670.70
0.65%
Copper
4.16
0.1%
Oil
69.67
0.17%
Bitcoin
97,050.26
2.86%
FTSE 100
8,077.97
(0.09%)
Nikkei 225
38,026.17
(0.85%)
Dow Jones
43,408.47
0.26%
Iron Ore
102.20
1.16%
USD/AUD
0.65
0.2%
Hang Seng
19,601.11
(0.23%)
Lithium
45.28
0.49%
Gold
2,670.70
0.65%
Copper
4.16
0.1%
Oil
69.67
0.17%
Bitcoin
97,050.26
2.86%
FTSE 100
8,077.97
(0.09%)
Nikkei 225
38,026.17
(0.85%)
Dow Jones
43,408.47
0.26%
Iron Ore
102.20
1.16%
USD/AUD
0.65
0.2%
Hang Seng
19,601.11
(0.23%)
Lithium
45.28
0.49%
Gold
2,670.70
0.65%
Copper
4.16
0.1%
Oil
69.67
0.17%
Bitcoin
97,050.26
2.86%
FTSE 100
8,077.97
(0.09%)
Nikkei 225
38,026.17
(0.85%)
Dow Jones
43,408.47
0.26%
Iron Ore
102.20
1.16%
USD/AUD
0.65
0.2%
Hang Seng
19,601.11
(0.23%)
Lithium
45.28
0.49%
Gold
2,670.70
0.65%
Copper
4.16
0.1%
Oil
69.67
0.17%
Bitcoin
97,050.26
2.86%
FTSE 100
8,077.97
(0.09%)
Nikkei 225
38,026.17
(0.85%)
Dow Jones
43,408.47
0.26%
Iron Ore
102.20
1.16%
USD/AUD
0.65
0.2%
Hang Seng
19,601.11
(0.23%)
Lithium
45.28
0.49%
Gold
2,670.70
0.65%
Copper
4.16
0.1%
Oil
69.67
0.17%
Bitcoin
97,050.26
2.86%
FTSE 100
8,077.97
(0.09%)
Nikkei 225
38,026.17
(0.85%)
Dow Jones
43,408.47
0.26%
Iron Ore
102.20
1.16%
USD/AUD
0.65
0.2%
Hang Seng
19,601.11
(0.23%)
Lithium
45.28
0.49%
Gold
2,670.70
0.65%
Copper
4.16
0.1%
Oil
69.67
0.17%
Bitcoin
97,050.26
2.86%
FTSE 100
8,077.97
(0.09%)
Nikkei 225
38,026.17
(0.85%)
Dow Jones
43,408.47
0.26%
Iron Ore
102.20
1.16%
USD/AUD
0.65
0.2%
Hang Seng
19,601.11
(0.23%)
Lithium
45.28
0.49%
Gold
2,670.70
0.65%
Copper
4.16
0.1%
Oil
69.67
0.17%
Bitcoin
97,050.26
2.86%
FTSE 100
8,077.97
(0.09%)
Nikkei 225
38,026.17
(0.85%)
Dow Jones
43,408.47
0.26%
Iron Ore
102.20
1.16%
USD/AUD
0.65
0.2%
Hang Seng
19,601.11
(0.23%)
Lithium
45.28
0.49%
Gold
2,670.70
0.65%
Copper
4.16
0.1%
Oil
69.67
0.17%
Bitcoin
97,050.26
2.86%
FTSE 100
8,077.97
(0.09%)
Nikkei 225
38,026.17
(0.85%)
Dow Jones
43,408.47
0.26%
Iron Ore
102.20
1.16%
USD/AUD
0.65
0.2%
Hang Seng
19,601.11
(0.23%)
Lithium
45.28
0.49%
Gold
2,670.70
0.65%
Copper
4.16
0.1%
Oil
69.67
0.17%
Bitcoin
97,050.26
2.86%
FTSE 100
8,077.97
(0.09%)
Nikkei 225
38,026.17
(0.85%)
Dow Jones
43,408.47
0.26%
Iron Ore
102.20
1.16%
USD/AUD
0.65
0.2%
Hang Seng
19,601.11
(0.23%)
Lithium
45.28
0.49%
Gold
2,670.70
0.65%
Copper
4.16
0.1%
Oil
69.67
0.17%
Bitcoin
97,050.26
2.86%
FTSE 100
8,077.97
(0.09%)
Nikkei 225
38,026.17
(0.85%)
Dow Jones
43,408.47
0.26%
Iron Ore
102.20
1.16%
USD/AUD
0.65
0.2%
Hang Seng
19,601.11
(0.23%)
Lithium
45.28
0.49%
Gold
2,670.70
0.65%
Copper
4.16
0.1%
Oil
69.67
0.17%
Bitcoin
97,050.26
2.86%
FTSE 100
8,077.97
(0.09%)
Nikkei 225
38,026.17
(0.85%)
Dow Jones
43,408.47
0.26%
Iron Ore
102.20
1.16%
USD/AUD
0.65
0.2%
Hang Seng
19,601.11
(0.23%)
Lithium
45.28
0.49%
Gold
2,670.70
0.65%
Copper
4.16
0.1%
Oil
69.67
0.17%
Bitcoin
97,050.26
2.86%
FTSE 100
8,077.97
(0.09%)
Nikkei 225
38,026.17
(0.85%)
Dow Jones
43,408.47
0.26%
Iron Ore
102.20
1.16%
USD/AUD
0.65
0.2%
Hang Seng
19,601.11
(0.23%)
Lithium
45.28
0.49%
Gold
2,670.70
0.65%
Copper
4.16
0.1%
Oil
69.67
0.17%
Bitcoin
97,050.26
2.86%
FTSE 100
8,077.97
(0.09%)
Nikkei 225
38,026.17
(0.85%)
Dow Jones
43,408.47
0.26%
Iron Ore
102.20
1.16%
USD/AUD
0.65
0.2%
Hang Seng
19,601.11
(0.23%)
Lithium
45.28
0.49%
Gold
2,670.70
0.65%
Copper
4.16
0.1%
Oil
69.67
0.17%
Bitcoin
97,050.26
2.86%
FTSE 100
8,077.97
(0.09%)
Nikkei 225
38,026.17
(0.85%)
Dow Jones
43,408.47
0.26%
Iron Ore
102.20
1.16%
USD/AUD
0.65
0.2%
Hang Seng
19,601.11
(0.23%)

Gale Pacific (ASX: $GAP) reports disappointing FY24 financial performance

Gale Pacific's FY24 financial results


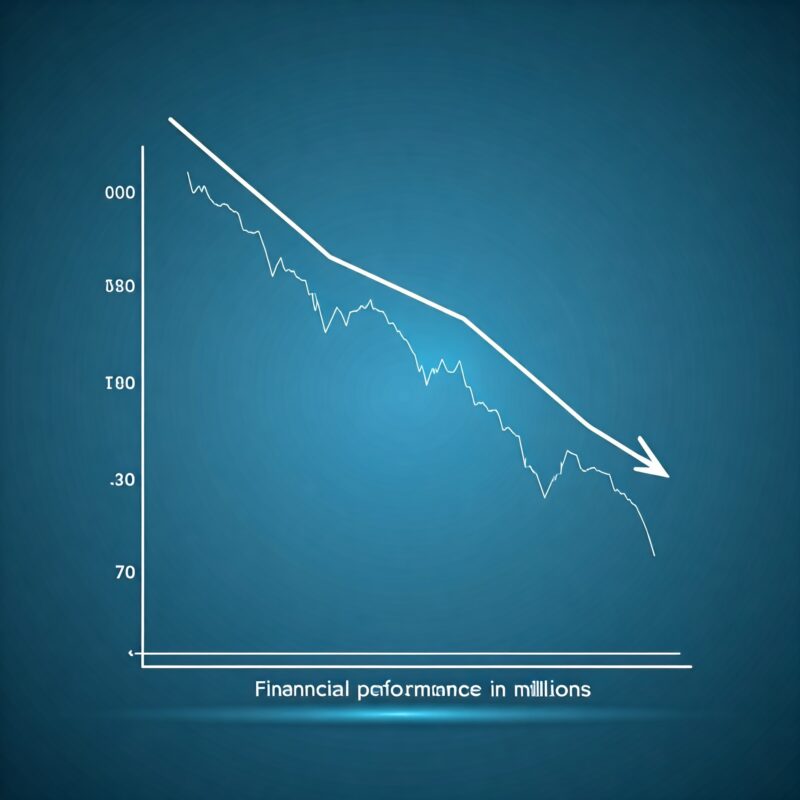
Gale Pacific (ASX:GAP) has announced disappointing financial results for the fiscal year ending June 30, 2024. The company reported a pre-tax loss of $1.4 million, a significant decline from a $5.3 million profit the previous year. The downturn was primarily due to adverse weather conditions and weak retail markets, which impacted revenue growth. Additionally, increased operating expenses, including a $5 million expenditure on a new ERP system, contributed to the reduced earnings.

Outlook for Gale Pacific's future performance


Gale Pacific experienced a challenging FY24, with a shift from profit to a pre-tax loss due to adverse market conditions and increased expenses, including a $5 million investment in a new ERP system. However, the company demonstrated resilience with strong cash flow, which enabled capital expenditure and a substantial reduction in net debt. The appointment of Troy Mortleman as CEO and corporate restructuring are expected to streamline operations and cut costs by $4 million annually. The new ERP system, which went live on October 1st, is projected to enhance operational efficiency. Looking ahead, Gale Pacific anticipates improved trading conditions and aims for an EBITDA of $5.5 million to $6.5 million in the first half of FY25, with underlying EBITDA expected to be between $8.5 million and $9.5 million, excluding one-time expenses. The company's strategic focus remains on product innovation, category expansion, and distribution growth, with a positive outlook for the first quarter of FY25, driven by new product listings and favorable market conditions.

Executive insights on Gale Pacific's FY24 performance


Despite the challenging conditions we faced in FY24, we have taken strategic steps to position Gale Pacific for future success. The implementation of the Dynamics 365 ERP system and the appointment of a new CEO are integral to our strategy moving forward. We expect these changes to result in significant operational improvements and cost savings.


GALE PACIFIC LIMITED
GAP | ASX | Consumer Discretionary
0.1350(+0%)
At close (AEDT)
Market cap
$
Volume
0
DY Yield
PE Ratio
52 Week Range
-
1YR Return
N / A

0 Comments
Inline Feedbacks
View all comments
Social Media Auto Publish Powered By : XYZScripts.com

Stock Piper AI Index Coming Soon!

Join our Newsletter to gain exclusive insight and be notified once we are live.

By clicking Subscribe, you agree to our Terms & Conditions

ASX News, First And Fast.

Get all the latest market updates straight to your inbox.

By clicking Subscribe, you agree to our Terms & Conditions