Lithium
45.57
0.6%
Gold
2,683.40
0.43%
Copper
4.11
(0.06%)
Oil
70.44
0.37%
Bitcoin
98,444.76
(0.01%)
FTSE 100
8,149.30
0.79%
Nikkei 225
38,386.91
0.63%
Dow Jones
43,870.35
0.76%
Iron Ore
102.25
0.24%
USD/AUD
0.65
0.01%
Hang Seng
19,556.67
(0.29%)
Lithium
45.57
0.6%
Gold
2,683.40
0.43%
Copper
4.11
(0.06%)
Oil
70.44
0.37%
Bitcoin
98,444.76
(0.01%)
FTSE 100
8,149.30
0.79%
Nikkei 225
38,386.91
0.63%
Dow Jones
43,870.35
0.76%
Iron Ore
102.25
0.24%
USD/AUD
0.65
0.01%
Hang Seng
19,556.67
(0.29%)
Lithium
45.57
0.6%
Gold
2,683.40
0.43%
Copper
4.11
(0.06%)
Oil
70.44
0.37%
Bitcoin
98,444.76
(0.01%)
FTSE 100
8,149.30
0.79%
Nikkei 225
38,386.91
0.63%
Dow Jones
43,870.35
0.76%
Iron Ore
102.25
0.24%
USD/AUD
0.65
0.01%
Hang Seng
19,556.67
(0.29%)
Lithium
45.57
0.6%
Gold
2,683.40
0.43%
Copper
4.11
(0.06%)
Oil
70.44
0.37%
Bitcoin
98,444.76
(0.01%)
FTSE 100
8,149.30
0.79%
Nikkei 225
38,386.91
0.63%
Dow Jones
43,870.35
0.76%
Iron Ore
102.25
0.24%
USD/AUD
0.65
0.01%
Hang Seng
19,556.67
(0.29%)
Lithium
45.57
0.6%
Gold
2,683.40
0.43%
Copper
4.11
(0.06%)
Oil
70.44
0.37%
Bitcoin
98,444.76
(0.01%)
FTSE 100
8,149.30
0.79%
Nikkei 225
38,386.91
0.63%
Dow Jones
43,870.35
0.76%
Iron Ore
102.25
0.24%
USD/AUD
0.65
0.01%
Hang Seng
19,556.67
(0.29%)
Lithium
45.57
0.6%
Gold
2,683.40
0.43%
Copper
4.11
(0.06%)
Oil
70.44
0.37%
Bitcoin
98,444.76
(0.01%)
FTSE 100
8,149.30
0.79%
Nikkei 225
38,386.91
0.63%
Dow Jones
43,870.35
0.76%
Iron Ore
102.25
0.24%
USD/AUD
0.65
0.01%
Hang Seng
19,556.67
(0.29%)
Lithium
45.57
0.6%
Gold
2,683.40
0.43%
Copper
4.11
(0.06%)
Oil
70.44
0.37%
Bitcoin
98,444.76
(0.01%)
FTSE 100
8,149.30
0.79%
Nikkei 225
38,386.91
0.63%
Dow Jones
43,870.35
0.76%
Iron Ore
102.25
0.24%
USD/AUD
0.65
0.01%
Hang Seng
19,556.67
(0.29%)
Lithium
45.57
0.6%
Gold
2,683.40
0.43%
Copper
4.11
(0.06%)
Oil
70.44
0.37%
Bitcoin
98,444.76
(0.01%)
FTSE 100
8,149.30
0.79%
Nikkei 225
38,386.91
0.63%
Dow Jones
43,870.35
0.76%
Iron Ore
102.25
0.24%
USD/AUD
0.65
0.01%
Hang Seng
19,556.67
(0.29%)
Lithium
45.57
0.6%
Gold
2,683.40
0.43%
Copper
4.11
(0.06%)
Oil
70.44
0.37%
Bitcoin
98,444.76
(0.01%)
FTSE 100
8,149.30
0.79%
Nikkei 225
38,386.91
0.63%
Dow Jones
43,870.35
0.76%
Iron Ore
102.25
0.24%
USD/AUD
0.65
0.01%
Hang Seng
19,556.67
(0.29%)
Lithium
45.57
0.6%
Gold
2,683.40
0.43%
Copper
4.11
(0.06%)
Oil
70.44
0.37%
Bitcoin
98,444.76
(0.01%)
FTSE 100
8,149.30
0.79%
Nikkei 225
38,386.91
0.63%
Dow Jones
43,870.35
0.76%
Iron Ore
102.25
0.24%
USD/AUD
0.65
0.01%
Hang Seng
19,556.67
(0.29%)
Lithium
45.57
0.6%
Gold
2,683.40
0.43%
Copper
4.11
(0.06%)
Oil
70.44
0.37%
Bitcoin
98,444.76
(0.01%)
FTSE 100
8,149.30
0.79%
Nikkei 225
38,386.91
0.63%
Dow Jones
43,870.35
0.76%
Iron Ore
102.25
0.24%
USD/AUD
0.65
0.01%
Hang Seng
19,556.67
(0.29%)
Lithium
45.57
0.6%
Gold
2,683.40
0.43%
Copper
4.11
(0.06%)
Oil
70.44
0.37%
Bitcoin
98,444.76
(0.01%)
FTSE 100
8,149.30
0.79%
Nikkei 225
38,386.91
0.63%
Dow Jones
43,870.35
0.76%
Iron Ore
102.25
0.24%
USD/AUD
0.65
0.01%
Hang Seng
19,556.67
(0.29%)
Lithium
45.57
0.6%
Gold
2,683.40
0.43%
Copper
4.11
(0.06%)
Oil
70.44
0.37%
Bitcoin
98,444.76
(0.01%)
FTSE 100
8,149.30
0.79%
Nikkei 225
38,386.91
0.63%
Dow Jones
43,870.35
0.76%
Iron Ore
102.25
0.24%
USD/AUD
0.65
0.01%
Hang Seng
19,556.67
(0.29%)
Lithium
45.57
0.6%
Gold
2,683.40
0.43%
Copper
4.11
(0.06%)
Oil
70.44
0.37%
Bitcoin
98,444.76
(0.01%)
FTSE 100
8,149.30
0.79%
Nikkei 225
38,386.91
0.63%
Dow Jones
43,870.35
0.76%
Iron Ore
102.25
0.24%
USD/AUD
0.65
0.01%
Hang Seng
19,556.67
(0.29%)
Lithium
45.57
0.6%
Gold
2,683.40
0.43%
Copper
4.11
(0.06%)
Oil
70.44
0.37%
Bitcoin
98,444.76
(0.01%)
FTSE 100
8,149.30
0.79%
Nikkei 225
38,386.91
0.63%
Dow Jones
43,870.35
0.76%
Iron Ore
102.25
0.24%
USD/AUD
0.65
0.01%
Hang Seng
19,556.67
(0.29%)
Lithium
45.57
0.6%
Gold
2,683.40
0.43%
Copper
4.11
(0.06%)
Oil
70.44
0.37%
Bitcoin
98,444.76
(0.01%)
FTSE 100
8,149.30
0.79%
Nikkei 225
38,386.91
0.63%
Dow Jones
43,870.35
0.76%
Iron Ore
102.25
0.24%
USD/AUD
0.65
0.01%
Hang Seng
19,556.67
(0.29%)
Lithium
45.57
0.6%
Gold
2,683.40
0.43%
Copper
4.11
(0.06%)
Oil
70.44
0.37%
Bitcoin
98,444.76
(0.01%)
FTSE 100
8,149.30
0.79%
Nikkei 225
38,386.91
0.63%
Dow Jones
43,870.35
0.76%
Iron Ore
102.25
0.24%
USD/AUD
0.65
0.01%
Hang Seng
19,556.67
(0.29%)
Lithium
45.57
0.6%
Gold
2,683.40
0.43%
Copper
4.11
(0.06%)
Oil
70.44
0.37%
Bitcoin
98,444.76
(0.01%)
FTSE 100
8,149.30
0.79%
Nikkei 225
38,386.91
0.63%
Dow Jones
43,870.35
0.76%
Iron Ore
102.25
0.24%
USD/AUD
0.65
0.01%
Hang Seng
19,556.67
(0.29%)
Lithium
45.57
0.6%
Gold
2,683.40
0.43%
Copper
4.11
(0.06%)
Oil
70.44
0.37%
Bitcoin
98,444.76
(0.01%)
FTSE 100
8,149.30
0.79%
Nikkei 225
38,386.91
0.63%
Dow Jones
43,870.35
0.76%
Iron Ore
102.25
0.24%
USD/AUD
0.65
0.01%
Hang Seng
19,556.67
(0.29%)
Lithium
45.57
0.6%
Gold
2,683.40
0.43%
Copper
4.11
(0.06%)
Oil
70.44
0.37%
Bitcoin
98,444.76
(0.01%)
FTSE 100
8,149.30
0.79%
Nikkei 225
38,386.91
0.63%
Dow Jones
43,870.35
0.76%
Iron Ore
102.25
0.24%
USD/AUD
0.65
0.01%
Hang Seng
19,556.67
(0.29%)

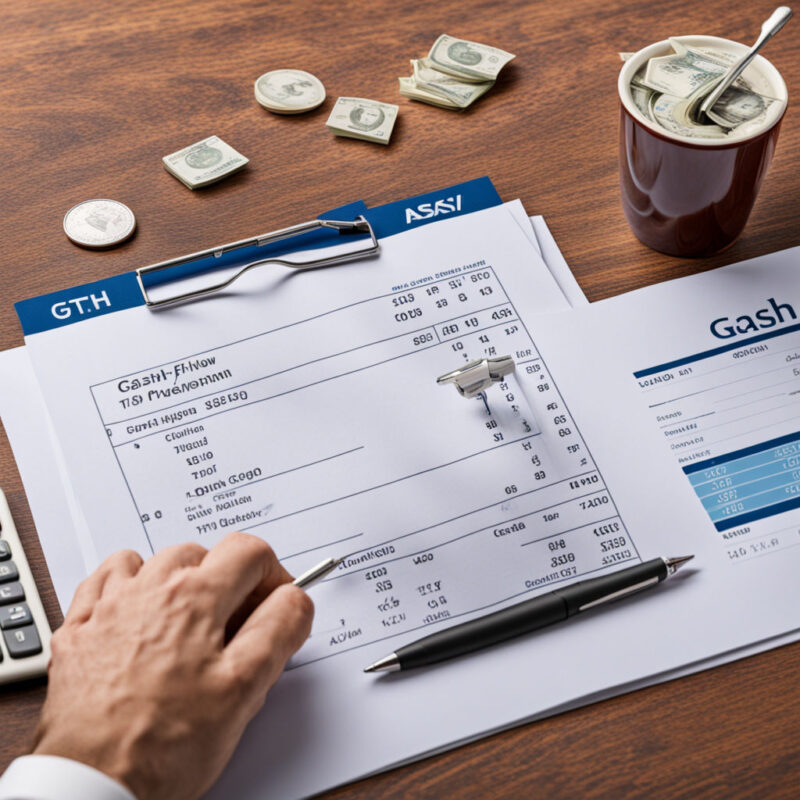
Gathid (ASX: $GTH) releases quarterly cash flow report

Gathid Ltd's Quarterly Cash Flow Report


Gathid Ltd (ASX: $GTH) has released its Quarterly Cash Flow statement (Appendix 4C) for the quarter ended 31 March 2024. The report includes details on payments to related entities, with the Managing Director and Executive Director's remuneration and fees paid to the Board of Directors of Gathid amounting to $0.146m during the quarter. All figures in the release are provided on an unaudited basis.

Executive Commentary on Quarterly Cash Flow


The Company presentation may include certain statements, estimates, or projections with respect to the anticipated future performance of the Company and its projects. These are based on assumptions about future events and management actions that may not necessarily take place and are subject to significant uncertainties, many of which are outside the control of the Company. No representation is made as to the accuracy of those statements, estimates, or projections.

Summary of Quarterly Cash Flow Report


Gathid Ltd's release of the Quarterly Cash Flow report for the quarter ended 31 March 2024 provides insights into the company's financial activities during the period. The unaudited report includes details on payments to related entities, specifically the remuneration and fees paid to the Board of Directors. The Company's future performance and projects are outlined with a disclaimer on the uncertainties and assumptions underlying the statements, estimates, or projections. Investors are encouraged to refer to the complete report for a comprehensive understanding of Gathid's financial position and outlook.
GATHID LTD
GTH | ASX | Information Technology
0.0180(+0%)
At close 21/11 (AEDT)
Market cap
$0
Volume
0
DY Yield
PE Ratio
52 Week Range
-
1YR Return
N / A

0 Comments
Inline Feedbacks
View all comments
Social Media Auto Publish Powered By : XYZScripts.com

Stock Piper AI Index Coming Soon!

Join our Newsletter to gain exclusive insight and be notified once we are live.

By clicking Subscribe, you agree to our Terms & Conditions

ASX News, First And Fast.

Get all the latest market updates straight to your inbox.

By clicking Subscribe, you agree to our Terms & Conditions