Lithium
45.28
0.49%
Gold
2,667.20
0.52%
Copper
4.14
(0.29%)
Oil
70.07
1.49%
Bitcoin
97,609.86
3.45%
FTSE 100
8,116.99
0.39%
Nikkei 225
38,026.17
(0.85%)
Dow Jones
43,408.47
0.26%
Iron Ore
102.15
1.11%
USD/AUD
0.65
0.26%
Hang Seng
19,601.11
(0.23%)
Lithium
45.28
0.49%
Gold
2,667.20
0.52%
Copper
4.14
(0.29%)
Oil
70.07
1.49%
Bitcoin
97,609.86
3.45%
FTSE 100
8,116.99
0.39%
Nikkei 225
38,026.17
(0.85%)
Dow Jones
43,408.47
0.26%
Iron Ore
102.15
1.11%
USD/AUD
0.65
0.26%
Hang Seng
19,601.11
(0.23%)
Lithium
45.28
0.49%
Gold
2,667.20
0.52%
Copper
4.14
(0.29%)
Oil
70.07
1.49%
Bitcoin
97,609.86
3.45%
FTSE 100
8,116.99
0.39%
Nikkei 225
38,026.17
(0.85%)
Dow Jones
43,408.47
0.26%
Iron Ore
102.15
1.11%
USD/AUD
0.65
0.26%
Hang Seng
19,601.11
(0.23%)
Lithium
45.28
0.49%
Gold
2,667.20
0.52%
Copper
4.14
(0.29%)
Oil
70.07
1.49%
Bitcoin
97,609.86
3.45%
FTSE 100
8,116.99
0.39%
Nikkei 225
38,026.17
(0.85%)
Dow Jones
43,408.47
0.26%
Iron Ore
102.15
1.11%
USD/AUD
0.65
0.26%
Hang Seng
19,601.11
(0.23%)
Lithium
45.28
0.49%
Gold
2,667.20
0.52%
Copper
4.14
(0.29%)
Oil
70.07
1.49%
Bitcoin
97,609.86
3.45%
FTSE 100
8,116.99
0.39%
Nikkei 225
38,026.17
(0.85%)
Dow Jones
43,408.47
0.26%
Iron Ore
102.15
1.11%
USD/AUD
0.65
0.26%
Hang Seng
19,601.11
(0.23%)
Lithium
45.28
0.49%
Gold
2,667.20
0.52%
Copper
4.14
(0.29%)
Oil
70.07
1.49%
Bitcoin
97,609.86
3.45%
FTSE 100
8,116.99
0.39%
Nikkei 225
38,026.17
(0.85%)
Dow Jones
43,408.47
0.26%
Iron Ore
102.15
1.11%
USD/AUD
0.65
0.26%
Hang Seng
19,601.11
(0.23%)
Lithium
45.28
0.49%
Gold
2,667.20
0.52%
Copper
4.14
(0.29%)
Oil
70.07
1.49%
Bitcoin
97,609.86
3.45%
FTSE 100
8,116.99
0.39%
Nikkei 225
38,026.17
(0.85%)
Dow Jones
43,408.47
0.26%
Iron Ore
102.15
1.11%
USD/AUD
0.65
0.26%
Hang Seng
19,601.11
(0.23%)
Lithium
45.28
0.49%
Gold
2,667.20
0.52%
Copper
4.14
(0.29%)
Oil
70.07
1.49%
Bitcoin
97,609.86
3.45%
FTSE 100
8,116.99
0.39%
Nikkei 225
38,026.17
(0.85%)
Dow Jones
43,408.47
0.26%
Iron Ore
102.15
1.11%
USD/AUD
0.65
0.26%
Hang Seng
19,601.11
(0.23%)
Lithium
45.28
0.49%
Gold
2,667.20
0.52%
Copper
4.14
(0.29%)
Oil
70.07
1.49%
Bitcoin
97,609.86
3.45%
FTSE 100
8,116.99
0.39%
Nikkei 225
38,026.17
(0.85%)
Dow Jones
43,408.47
0.26%
Iron Ore
102.15
1.11%
USD/AUD
0.65
0.26%
Hang Seng
19,601.11
(0.23%)
Lithium
45.28
0.49%
Gold
2,667.20
0.52%
Copper
4.14
(0.29%)
Oil
70.07
1.49%
Bitcoin
97,609.86
3.45%
FTSE 100
8,116.99
0.39%
Nikkei 225
38,026.17
(0.85%)
Dow Jones
43,408.47
0.26%
Iron Ore
102.15
1.11%
USD/AUD
0.65
0.26%
Hang Seng
19,601.11
(0.23%)
Lithium
45.28
0.49%
Gold
2,667.20
0.52%
Copper
4.14
(0.29%)
Oil
70.07
1.49%
Bitcoin
97,609.86
3.45%
FTSE 100
8,116.99
0.39%
Nikkei 225
38,026.17
(0.85%)
Dow Jones
43,408.47
0.26%
Iron Ore
102.15
1.11%
USD/AUD
0.65
0.26%
Hang Seng
19,601.11
(0.23%)
Lithium
45.28
0.49%
Gold
2,667.20
0.52%
Copper
4.14
(0.29%)
Oil
70.07
1.49%
Bitcoin
97,609.86
3.45%
FTSE 100
8,116.99
0.39%
Nikkei 225
38,026.17
(0.85%)
Dow Jones
43,408.47
0.26%
Iron Ore
102.15
1.11%
USD/AUD
0.65
0.26%
Hang Seng
19,601.11
(0.23%)
Lithium
45.28
0.49%
Gold
2,667.20
0.52%
Copper
4.14
(0.29%)
Oil
70.07
1.49%
Bitcoin
97,609.86
3.45%
FTSE 100
8,116.99
0.39%
Nikkei 225
38,026.17
(0.85%)
Dow Jones
43,408.47
0.26%
Iron Ore
102.15
1.11%
USD/AUD
0.65
0.26%
Hang Seng
19,601.11
(0.23%)
Lithium
45.28
0.49%
Gold
2,667.20
0.52%
Copper
4.14
(0.29%)
Oil
70.07
1.49%
Bitcoin
97,609.86
3.45%
FTSE 100
8,116.99
0.39%
Nikkei 225
38,026.17
(0.85%)
Dow Jones
43,408.47
0.26%
Iron Ore
102.15
1.11%
USD/AUD
0.65
0.26%
Hang Seng
19,601.11
(0.23%)
Lithium
45.28
0.49%
Gold
2,667.20
0.52%
Copper
4.14
(0.29%)
Oil
70.07
1.49%
Bitcoin
97,609.86
3.45%
FTSE 100
8,116.99
0.39%
Nikkei 225
38,026.17
(0.85%)
Dow Jones
43,408.47
0.26%
Iron Ore
102.15
1.11%
USD/AUD
0.65
0.26%
Hang Seng
19,601.11
(0.23%)
Lithium
45.28
0.49%
Gold
2,667.20
0.52%
Copper
4.14
(0.29%)
Oil
70.07
1.49%
Bitcoin
97,609.86
3.45%
FTSE 100
8,116.99
0.39%
Nikkei 225
38,026.17
(0.85%)
Dow Jones
43,408.47
0.26%
Iron Ore
102.15
1.11%
USD/AUD
0.65
0.26%
Hang Seng
19,601.11
(0.23%)
Lithium
45.28
0.49%
Gold
2,667.20
0.52%
Copper
4.14
(0.29%)
Oil
70.07
1.49%
Bitcoin
97,609.86
3.45%
FTSE 100
8,116.99
0.39%
Nikkei 225
38,026.17
(0.85%)
Dow Jones
43,408.47
0.26%
Iron Ore
102.15
1.11%
USD/AUD
0.65
0.26%
Hang Seng
19,601.11
(0.23%)
Lithium
45.28
0.49%
Gold
2,667.20
0.52%
Copper
4.14
(0.29%)
Oil
70.07
1.49%
Bitcoin
97,609.86
3.45%
FTSE 100
8,116.99
0.39%
Nikkei 225
38,026.17
(0.85%)
Dow Jones
43,408.47
0.26%
Iron Ore
102.15
1.11%
USD/AUD
0.65
0.26%
Hang Seng
19,601.11
(0.23%)
Lithium
45.28
0.49%
Gold
2,667.20
0.52%
Copper
4.14
(0.29%)
Oil
70.07
1.49%
Bitcoin
97,609.86
3.45%
FTSE 100
8,116.99
0.39%
Nikkei 225
38,026.17
(0.85%)
Dow Jones
43,408.47
0.26%
Iron Ore
102.15
1.11%
USD/AUD
0.65
0.26%
Hang Seng
19,601.11
(0.23%)
Lithium
45.28
0.49%
Gold
2,667.20
0.52%
Copper
4.14
(0.29%)
Oil
70.07
1.49%
Bitcoin
97,609.86
3.45%
FTSE 100
8,116.99
0.39%
Nikkei 225
38,026.17
(0.85%)
Dow Jones
43,408.47
0.26%
Iron Ore
102.15
1.11%
USD/AUD
0.65
0.26%
Hang Seng
19,601.11
(0.23%)

Why Cobre looks ready for a bull swing –  in-depth technical analysis

Cobre Limited, an Australian mining company (ASX: $CBE), is actively looking for copper deposits in the Kalahari Copper Belt, and recently they have found a 40km long strip of the highest-grade copper. They focus on exploring and developing new copper mines, aiming to be a key player in the global copper supply chain. While their primary target is copper, Cobre prioritises sustainable practices and responsible resource extraction, striving to minimise environmental impact throughout their operations.

Many fundamental changes are happening in the company like recent successful test operations in Kalahari Copper Belt and KITW. Recently they also raised $4 million in funding for further exploration in Botswana.

But how’s the chart looking? In this article, we will cover an in-depth technical analysis of Cobre.

Cobre Limited (ASX: $CBE) Technical analysis

$CBE Weekly Chart

Let’s start with the weekly charts of Cobre, because a higher timeframe show the major trends of the stock.
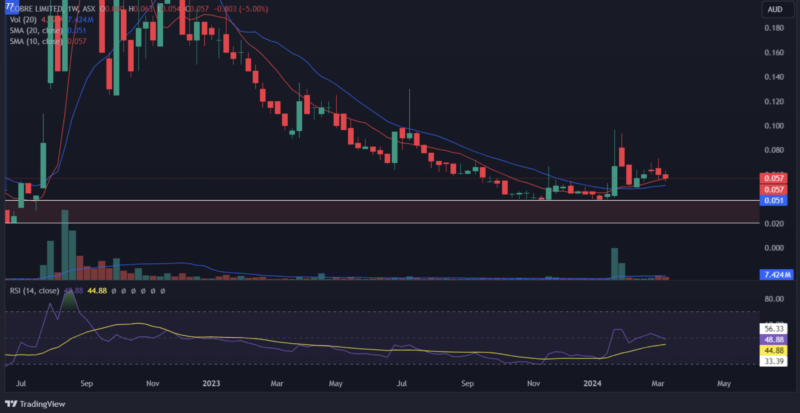
Cobre Limited (ASX: $CBE) is looking good in the weekly timeframe, the chart on the weekly view hints at a potential breakout. One sign supporting this is Cobre staying consistently above its 20-week moving average (blue line), which often indicates an underlying upward trend. Also, initially, the 10-week simple moving average (red line) served as resistance, but it's now functioning as reliable support, indicating a potential shift in sentiment. The recent major support and huge volumes are additional indications that the price is ready for an upswing.

Let’s look at the lower timeframe to look at the price action on a daily basis.

$CBE Daily Chart

In the daily timeframe price is moving in a channel, above which is a descending trendline, if the price breaks both of these resistances, an immediate up move to the last major resistance which is above 225% from the current price can be seen.

As we can see in the 1D timeframe, Cobre Limited (ASX: $CBE) is primed for a significant move upward. With supportive copper prices, all signs point to a potential explosion in value. 

Cobre’s Outlook

The technical indicators for Cobre's stock suggest an upward trend, pointing towards a potential breakout. However, the influence of technicals on stock performance is just one part of the story. Fundamental factors are crucial for sustained stock movement. In Cobre's case, recent fundamental developments are substantial and promising. These suggest that Cobre is well-prepared for both short-term improvements and long-term growth.

Our review highlights a solid foundation for Cobre: effective management, consistent execution, strategic diversification, and collaborative efforts. With a leadership focused on prudent decision-making and adequate funding for future projects, there's a reasonable expectation for Cobre's stock to experience growth over time. This combination of technical indicators and strong fundamentals positions Cobre as a strong contender for a rally this March 2024. 


Author

  • Mark Davidson is an experienced investment analyst and fund manager with a keen eye for identifying market trends. With a strong background in financial services, Mark has contributed to several successful investment ventures over his career. He holds a degree in Economics and has a passion for helping businesses grow and thrive.

    View all posts

0 Comments
Inline Feedbacks
View all comments
Social Media Auto Publish Powered By : XYZScripts.com

Stock Piper AI Index Coming Soon!

Join our Newsletter to gain exclusive insight and be notified once we are live.

By clicking Subscribe, you agree to our Terms & Conditions

ASX News, First And Fast.

Get all the latest market updates straight to your inbox.

By clicking Subscribe, you agree to our Terms & Conditions